News Tsunami
US Dollar: Mar. USD is Down at 100.790.
Energies: March Crude is Up at 53.17.
Financials: The Mar 30 year bond is Up 11 ticks and trading at 150.09.
Indices: The March S&P 500 emini ES contract is 9 ticks Lower and trading at 2348.25.
Gold: The April gold contract is trading Up at 1237.20. Gold is 42 ticks Higher than its close.
Initial Conclusion
This is not a correlated market. The dollar is Down- and crude is Up+ which is normal but the 30 year bond is trading Higher. The Financials should always correlate with the US dollar such that if the dollar is lower then bonds should follow and vice-versa. The indices are Down and Crude is trading Up which is correlated. Gold is trading Up which is correlated with the US dollar trading Down. I tend to believe that Gold has an inverse relationship with the US Dollar as when the US Dollar is down, Gold tends to rise in value and vice-versa. Think of it as a seesaw, when one is up the other should be down. I point this out to you to make you aware that when we don’t have a correlated market, it means something is wrong. As traders you need to be aware of this and proceed with your eyes wide open.
Asia traded mainly higher with the exception of the Nikkei exchange which traded lower. As of this writing Europe is trading mainly lower with the exception of the Milan exchange which is trading higher at this hour.
Possible Challenges To Traders Today
– Building Permits at 8:30 AM EST. This is major.
– Philly Fed Manufacturing Index at 8:30 AM EST. This is major.
– Unemployment Claims are out at 8:30 AM EST. This is major.
– Housing Starts is out at 8:30 AM EST. This is major.
– Nat Gas Storage is out at 10:30 AM EST. This is major.
Treasuries
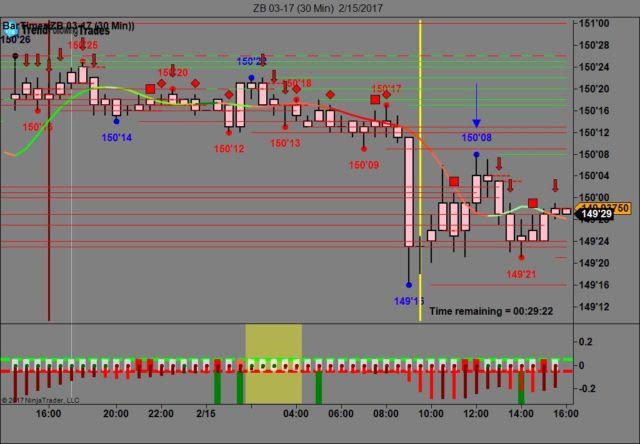
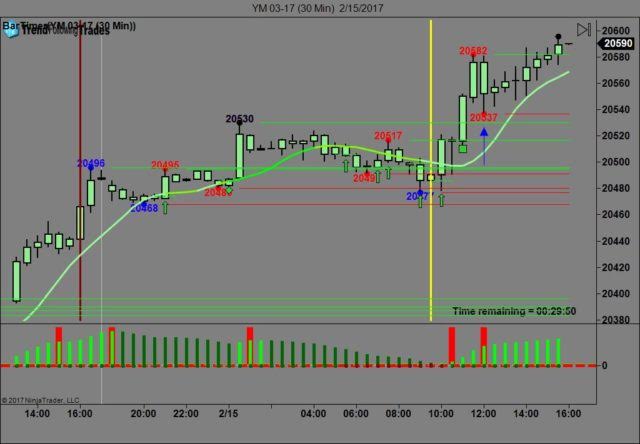
We’ve elected to switch gears a bit and show correlation between the 30 year bond (ZB) and The YM futures contract. The YM contract is the DJIA and the purpose is to show reverse correlation between the two instruments. Remember it’s liken to a seesaw, when up goes up the other should go down and vice versa.
Yesterday the ZB made it’s move at around 12 PM EST with no economic news in sight. The ZB hit a high at around that time and the YM hit a low. If you look at the charts below ZB gave a signal at around 12 PM and the YM was moving higher at the same time. Look at the charts below and you’ll see a pattern for both assets. ZB hit a high at around 12 PM EST and the YM hit a low. These charts represent the newest version of Trend Following Trades and I’ve changed the timeframe to a 30 minute chart to display better. This represented a shorting opportunity on the 30 year bond, as a trader you could have netted about 20 plus ticks per contract on this trade. Each tick is worth $31.25. We added a Donchian Channel to the charts to show the signals more clearly.
Charts Courtesy of Trend Following Trades built on a NinjaTrader platform.
Bias
Yesterday we gave the markets a neutral bias as both Gold and the USD were trading higher and this usually results in the indices trading lower however that didn’t happen yesterday morning, hence the neutral bias. The Dow traded 107 points higher and the other indices traded higher as well. Today we aren’t dealing with a correlated market and our bias is to the downside.
Could this change? Of Course. Remember anything can happen in a volatile market.
Commentary
Yesterday Janet Yellen completed her testimony to a Congressional Committee but that wasn’t what moved the markets yesterday. The market is foaming with an anticipated Trump Tax Plan that will call for massive tax cuts and the Street ate it up. They were apparently blind to anything else. Yesterday we had an unprecedented 14 economic reports but again that wasn’t the driver. This entire rally has been fueled with the expectation on a proposed tax plan that still hasn’t been shared. I just hope Trump can deliver on this plan.
Author

Nick Mastrandrea
Market Tea Leaves


