New Home Sales numbers showed a shortfall in new homes being sold in the USA

USD: Jun '24 is Down at 104.780.
Energies: Jul '24 Crude is Down at 76.48.
Financials: The June '24 30 Year T-Bond is Down 1 tick and trading at 116.25.
Indices: The Jun '24 S&P 500 emini ES contract is 60 ticks Higher and trading at 5300.25.
Gold: The Jun'24 Gold contract is trading Up at 2341.60
Initial conclusion
This is not a correlated market. The USD is Down and Crude is Down which is not normal, but the 30 Year T-Bond is trading Lower. The Financials should always correlate with the US dollar such that if the dollar is Higher, then the bonds should follow and vice-versa. The S&P is Higher and Crude is trading Lower which is correlated. Gold is trading Higher which is correlated with the US dollar trading Down. I tend to believe that Gold has an inverse relationship with the US Dollar as when the US Dollar is down, Gold tends to rise in value and vice-versa. Think of it as a seesaw, when one is up the other should be down. I point this out to you to make you aware that when we don't have a correlated market, it means something is wrong. As traders you need to be aware of this and proceed with your eyes wide open. All of Asia is trading Lower. All of Europe is trading Lower as well.
Possible challenges to traders
-
Core Durable Goods Orders m/m is out at 8:30 AM EST. This is Major.
-
Durable Goods Orders m/m is out at 8:30 AM EST. This is Major.
-
FOMC Member Waller Speaks at 9:35 AM EST. This is Major.
-
Revised UoM Consumer Sentiment is out at 10 AM EST. This is not Major.
-
Revised UoM Inflation Expectations is out at 10 AM EST. This is not Major.
Treasuries
Traders, please note that we've changed the Bond instrument from the 2 year (ZT) to the 10 year (ZN). They work exactly the same.
We've elected to switch gears a bit and show correlation between the 10-year Treasury notes (ZN) and the S&P futures contract. The S&P contract is the Standard and Poor's, and the purpose is to show reverse correlation between the two instruments. Remember it's likened to a seesaw, when up goes up the other should go down and vice versa.
Yesterday the ZN migrated Higher at around 9 AM EST as the S&P hit a High at around that time and the ZN migrated Higher. If you look at the charts below the ZN gave a signal at around 9 AM and started its Upward climb. Look at the charts below and you'll see a pattern for both assets. S&P moved Lower at around 9 AM and the ZN moving Higher at around the same time. These charts represent the newest version of MultiCharts and I've changed the timeframe to a 15-minute chart to display better. This represented a Long opportunity on the 10-year note, as a trader you could have netted about 10 ticks per contract on this trade. Each tick is worth $15.625. Please note: the front month for both the ZN and the S&P are now Jun '24. I've changed the format to filled Candlesticks (not hollow) such that it may be more apparent and visible.
Charts courtesy of MultiCharts built on an AMP platform
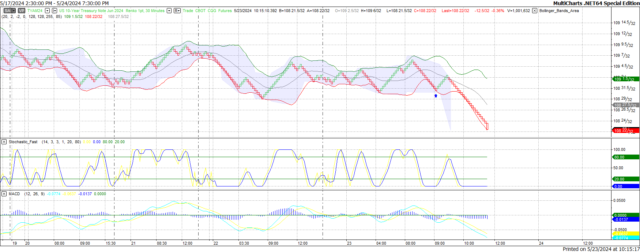
ZN -Jun 2024 - 05/23/24
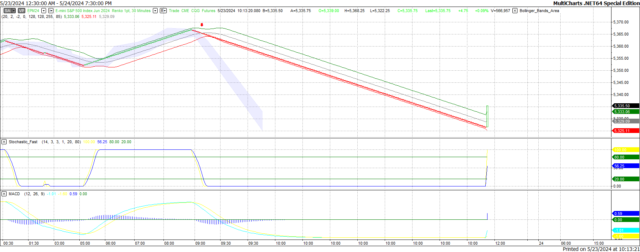
S&P - Jun 2024 - 05/23/24
Bias
Yesterday we gave the markets an Upside bias, but the markets had other plans. The Dow dropped dramatically after 10 AM EST and didn't migrate into positive territory at all yesterday. The other indices didn't fare better either. Today we aren't dealing with a correlated market and our bias is to the Upside.
Could this change? Of Course. Remember anything can happen in a volatile market.
Commentary
Yesterday we were all setup for an Upside Day. The markets were correlated to the Upside and upon market open it migrate Higher. However, a funny thing happened after 10 AM EST. The New Home Sales numbers were released, and it showed a shortfall in new homes being sold in the USA. The number came in at 634,000 versus 677,000 predicted. The markets dropped into negative territory and did not recover at any time during the session. And as we always say, this too can change. Monday is of course Memorial Day and we all get a day off. However if you know a Veteran or run into one give them thanks for their service. They bought the freedom that we enjoy. We'll be back on Tuesday the 28th. Enjoy and have a safe holiday!!!
Author

Nick Mastrandrea
Market Tea Leaves


