|

Moderate change in trend US stocks, T-Bonds, US Dollar

12/08 Recap: - The S&P opened with a 4 handle gap up, and then declined 9 handles into a 9:39 PM low. From that low, the S&P rallied 16 handles into a 9:53 PM high. From that high, the S&P zig-zagged 23 handles lower into an 11:04 AM low. From that low, the S&P rallied 30 handles into a 3:54 PM high of the day. From that high, the S&P pulled back 4 handles into the close.

SPX

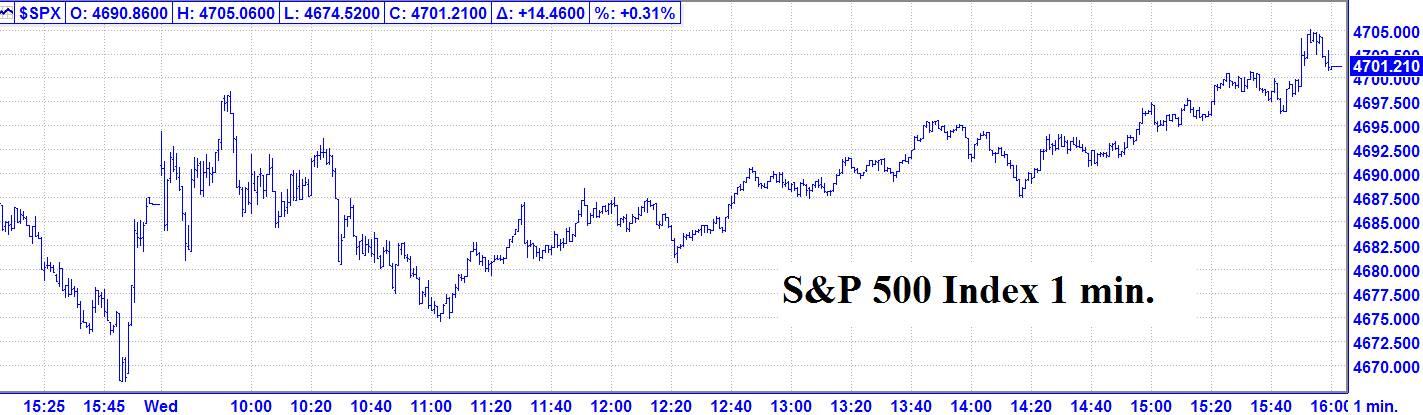
12/08 – The major indices, closed with a small to moderate up day with the following closes: The DJIA + 35.32; S&P 500 + 14.46; and the Nasdaq Composite + 100.07.

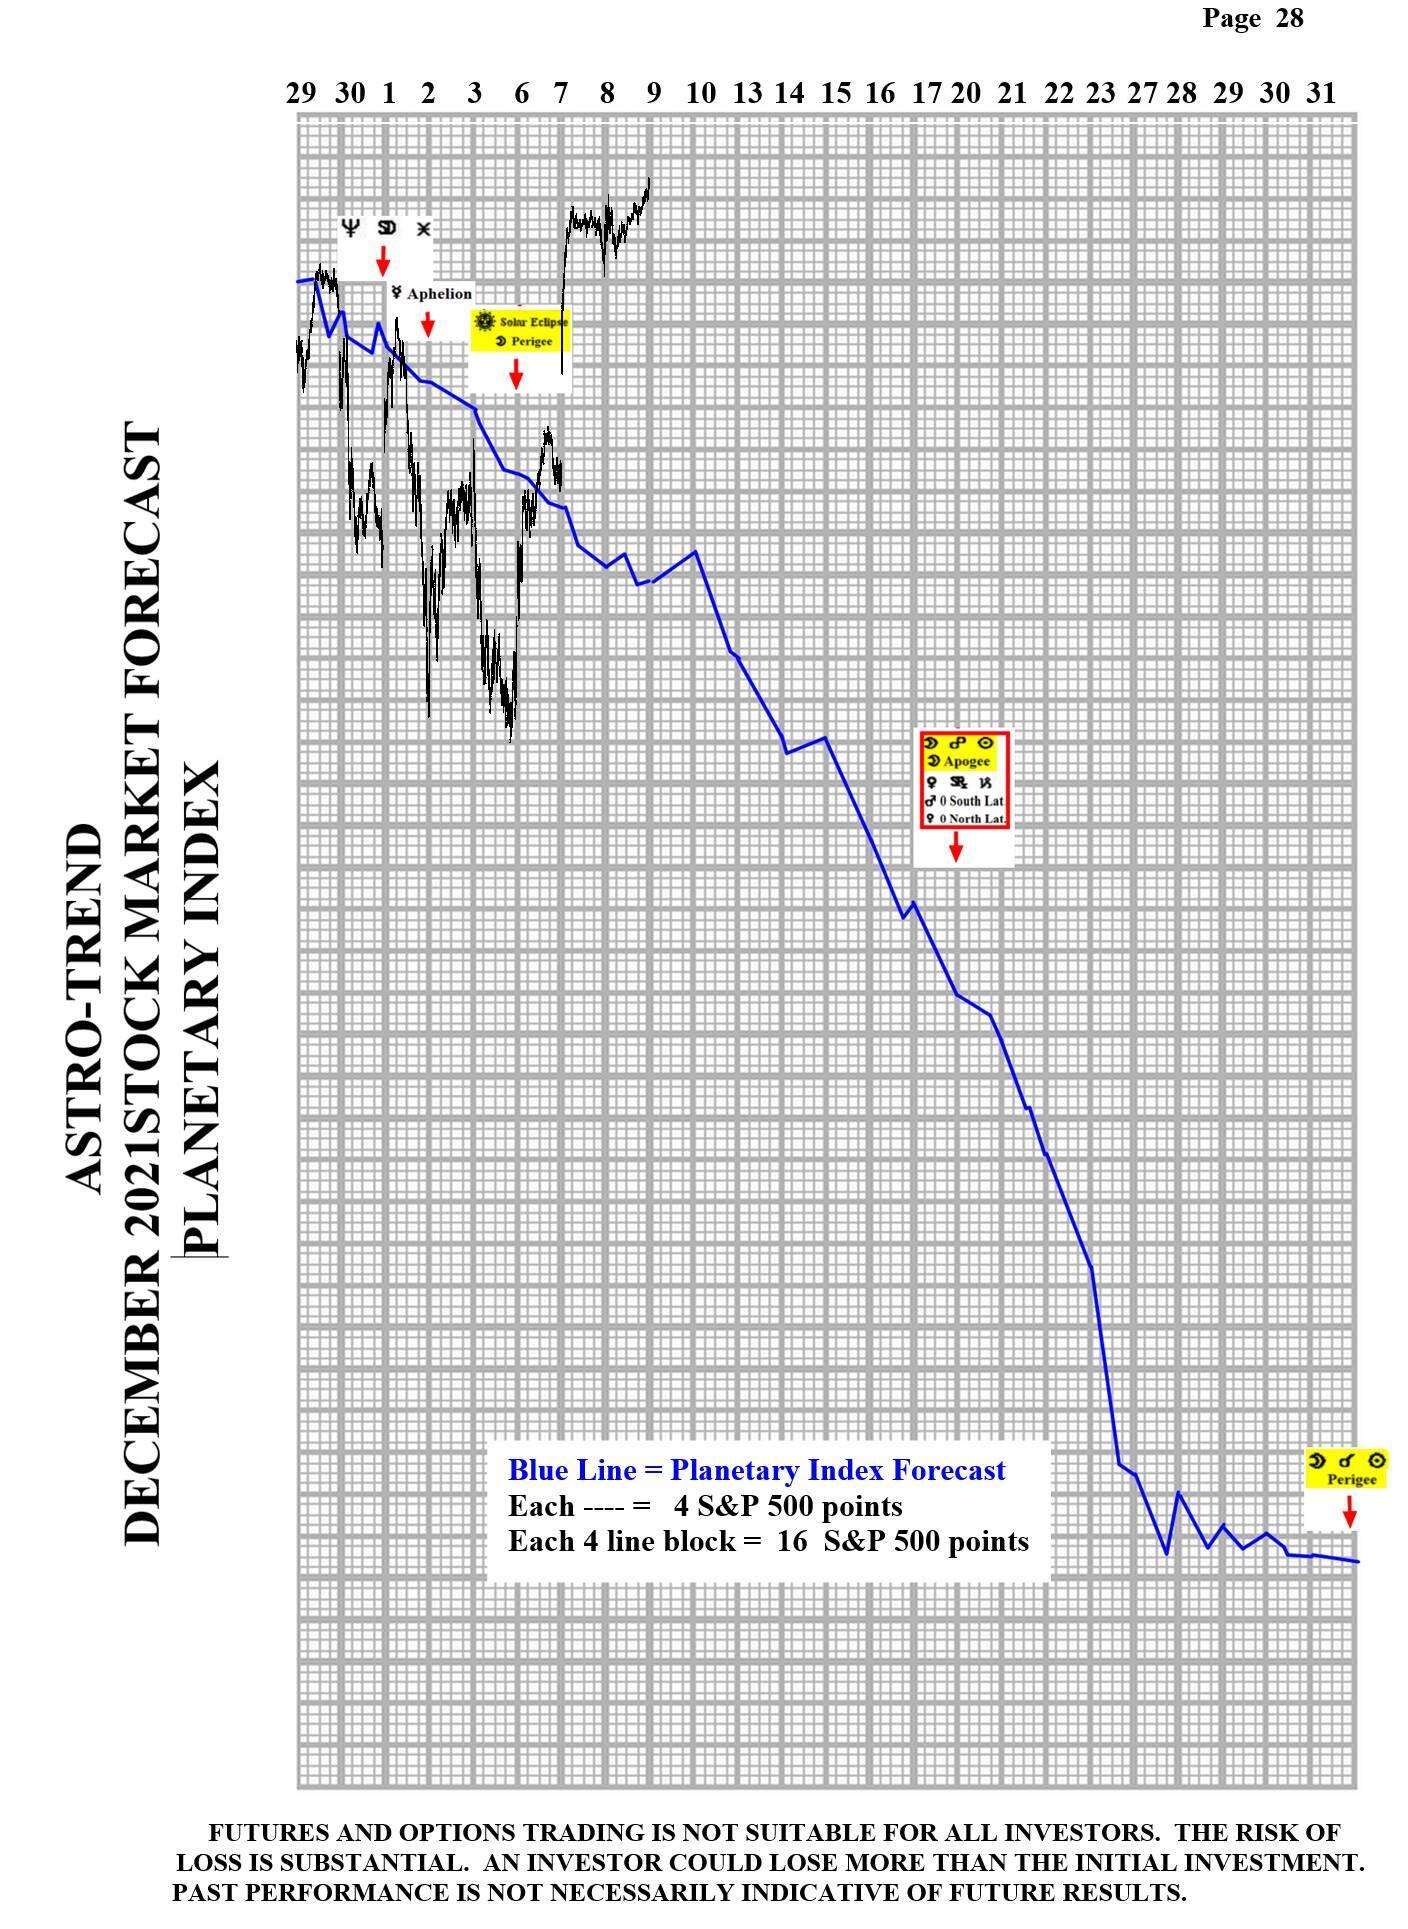
Looking ahead – The Astro picture is relative quiet for the next ten days. It looks like the uptrend is firmly established and should continue into 12/17. Which is the next major change in trend window. However, with Geo Mars changing signs over the 12/10 weekend, there may be a brief correction.

The NOW Index has returned to the NEUTRAL ZONE.

Coming events

(Stocks potentially respond to all events).

2. A. 12/10 AC – Geo Mars enters Sagittarius. Important change in trend Oats.

B. 12/12 AC – Jupiter 45 US Part of Fortune. Moderate change in trend US Stocks, T-Bonds, US Dollar.

C. 12/15 AC – Jupiter 135 US Sun. Moderate change in trend US Stocks, T-Bonds, US Dollar.

Stock market key dates

Market Math

12/26 – 676 Days (26^2) from the 2/19/2020 major high.

12/28 – 15,54 (112^2) from the 8/25/1987 major high.

DJIA – 12/13, 12/22, 12/29, 12/31 AC.

Fibonacci – 12/10, 12/16, 12/20, 12/28, 12/30.

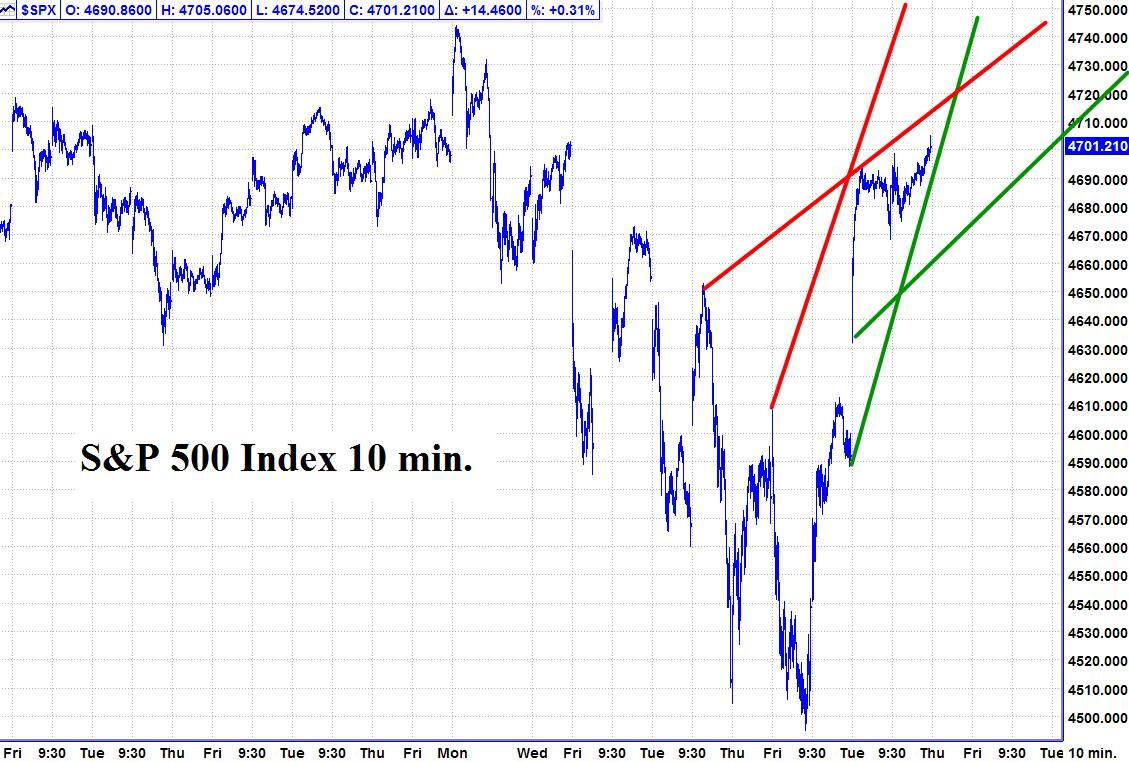
Please see below the S&P 500 10 minute chart.

Support - 4690, 4660 Resistance – 4720, 4745.

SPX

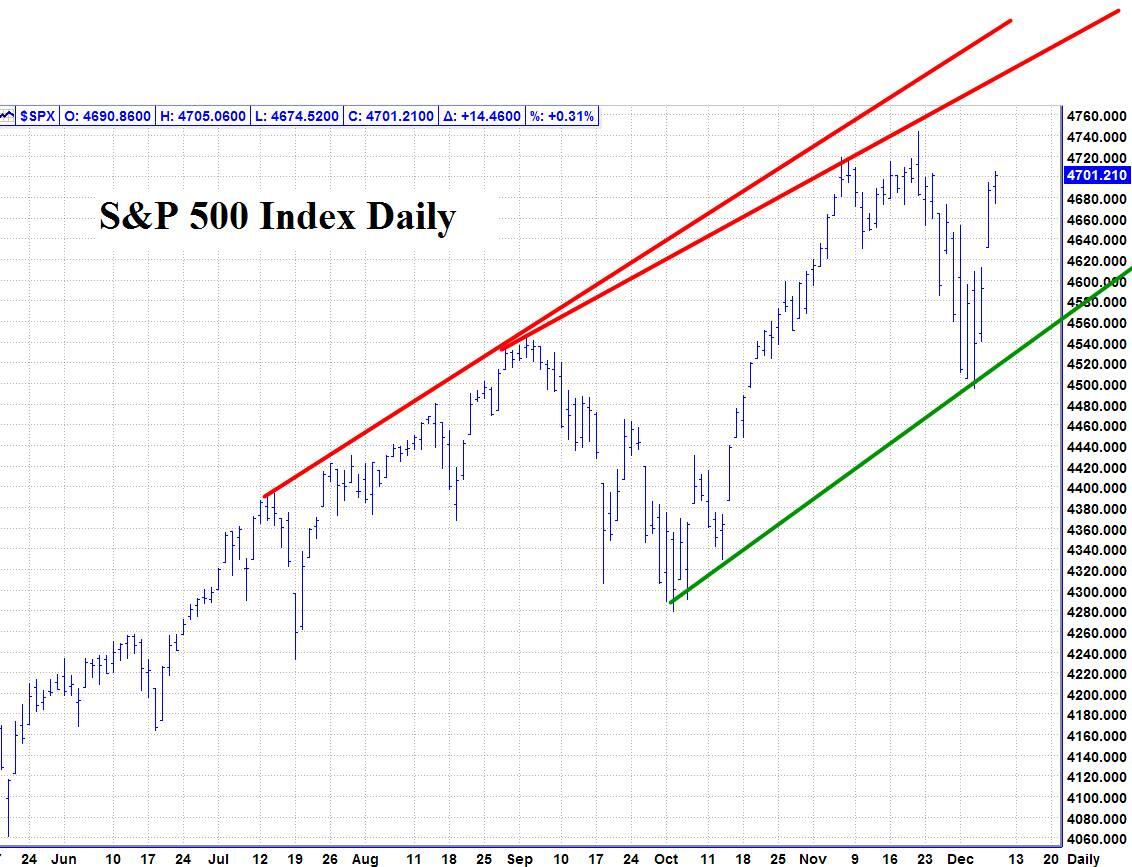
Please see below the S&P 500 Daily chart.

Support - 4690, 4660 Resistance – 4720, 4745.

SP 500

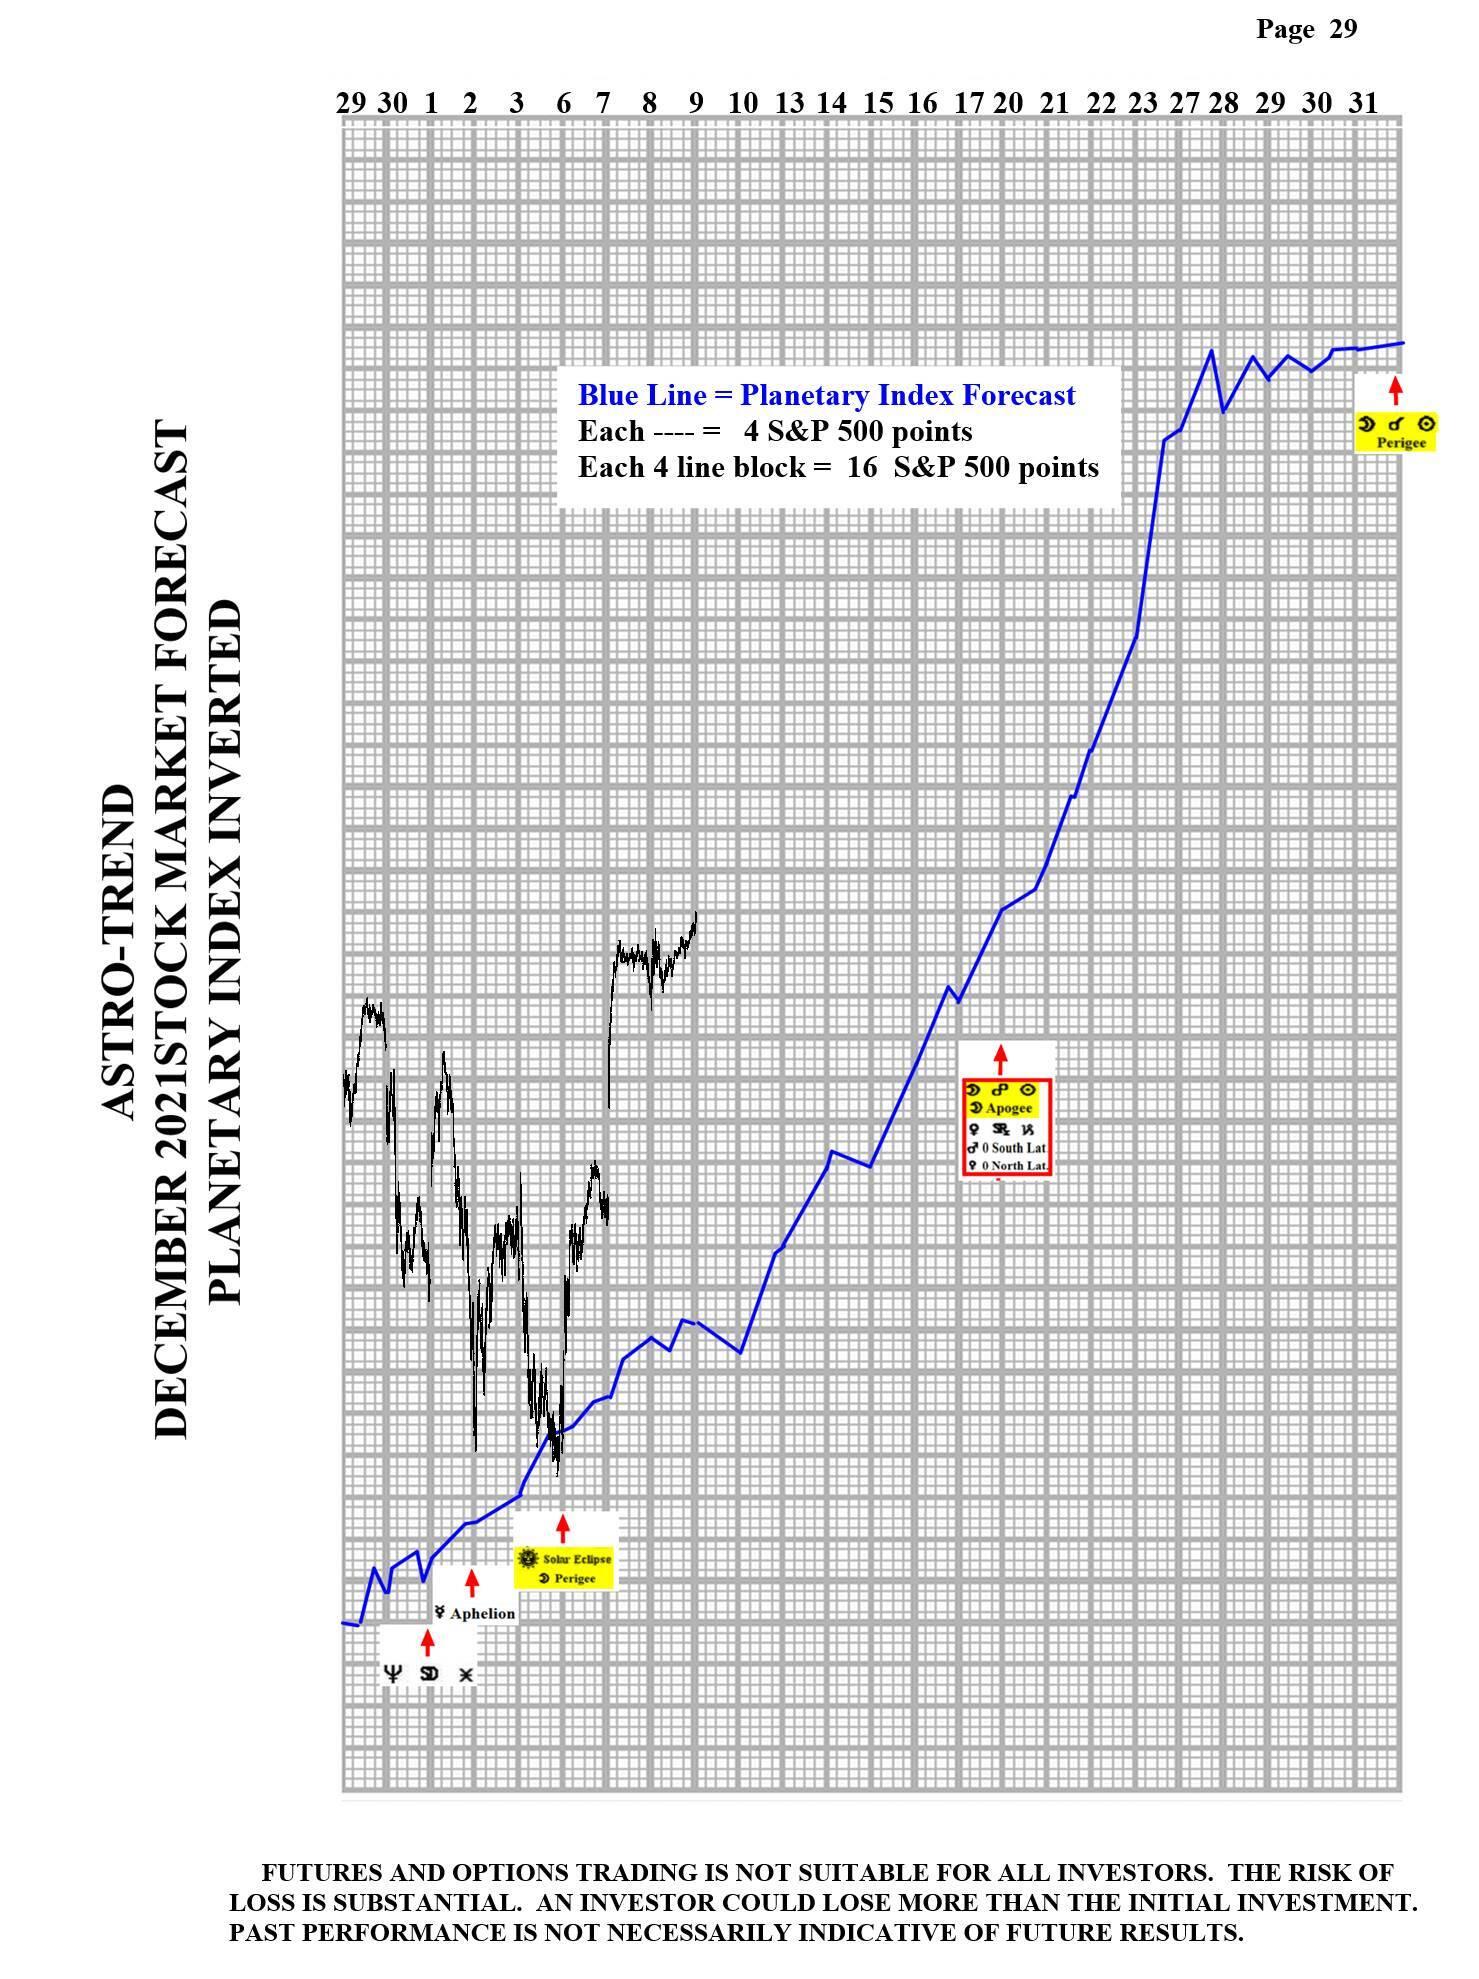
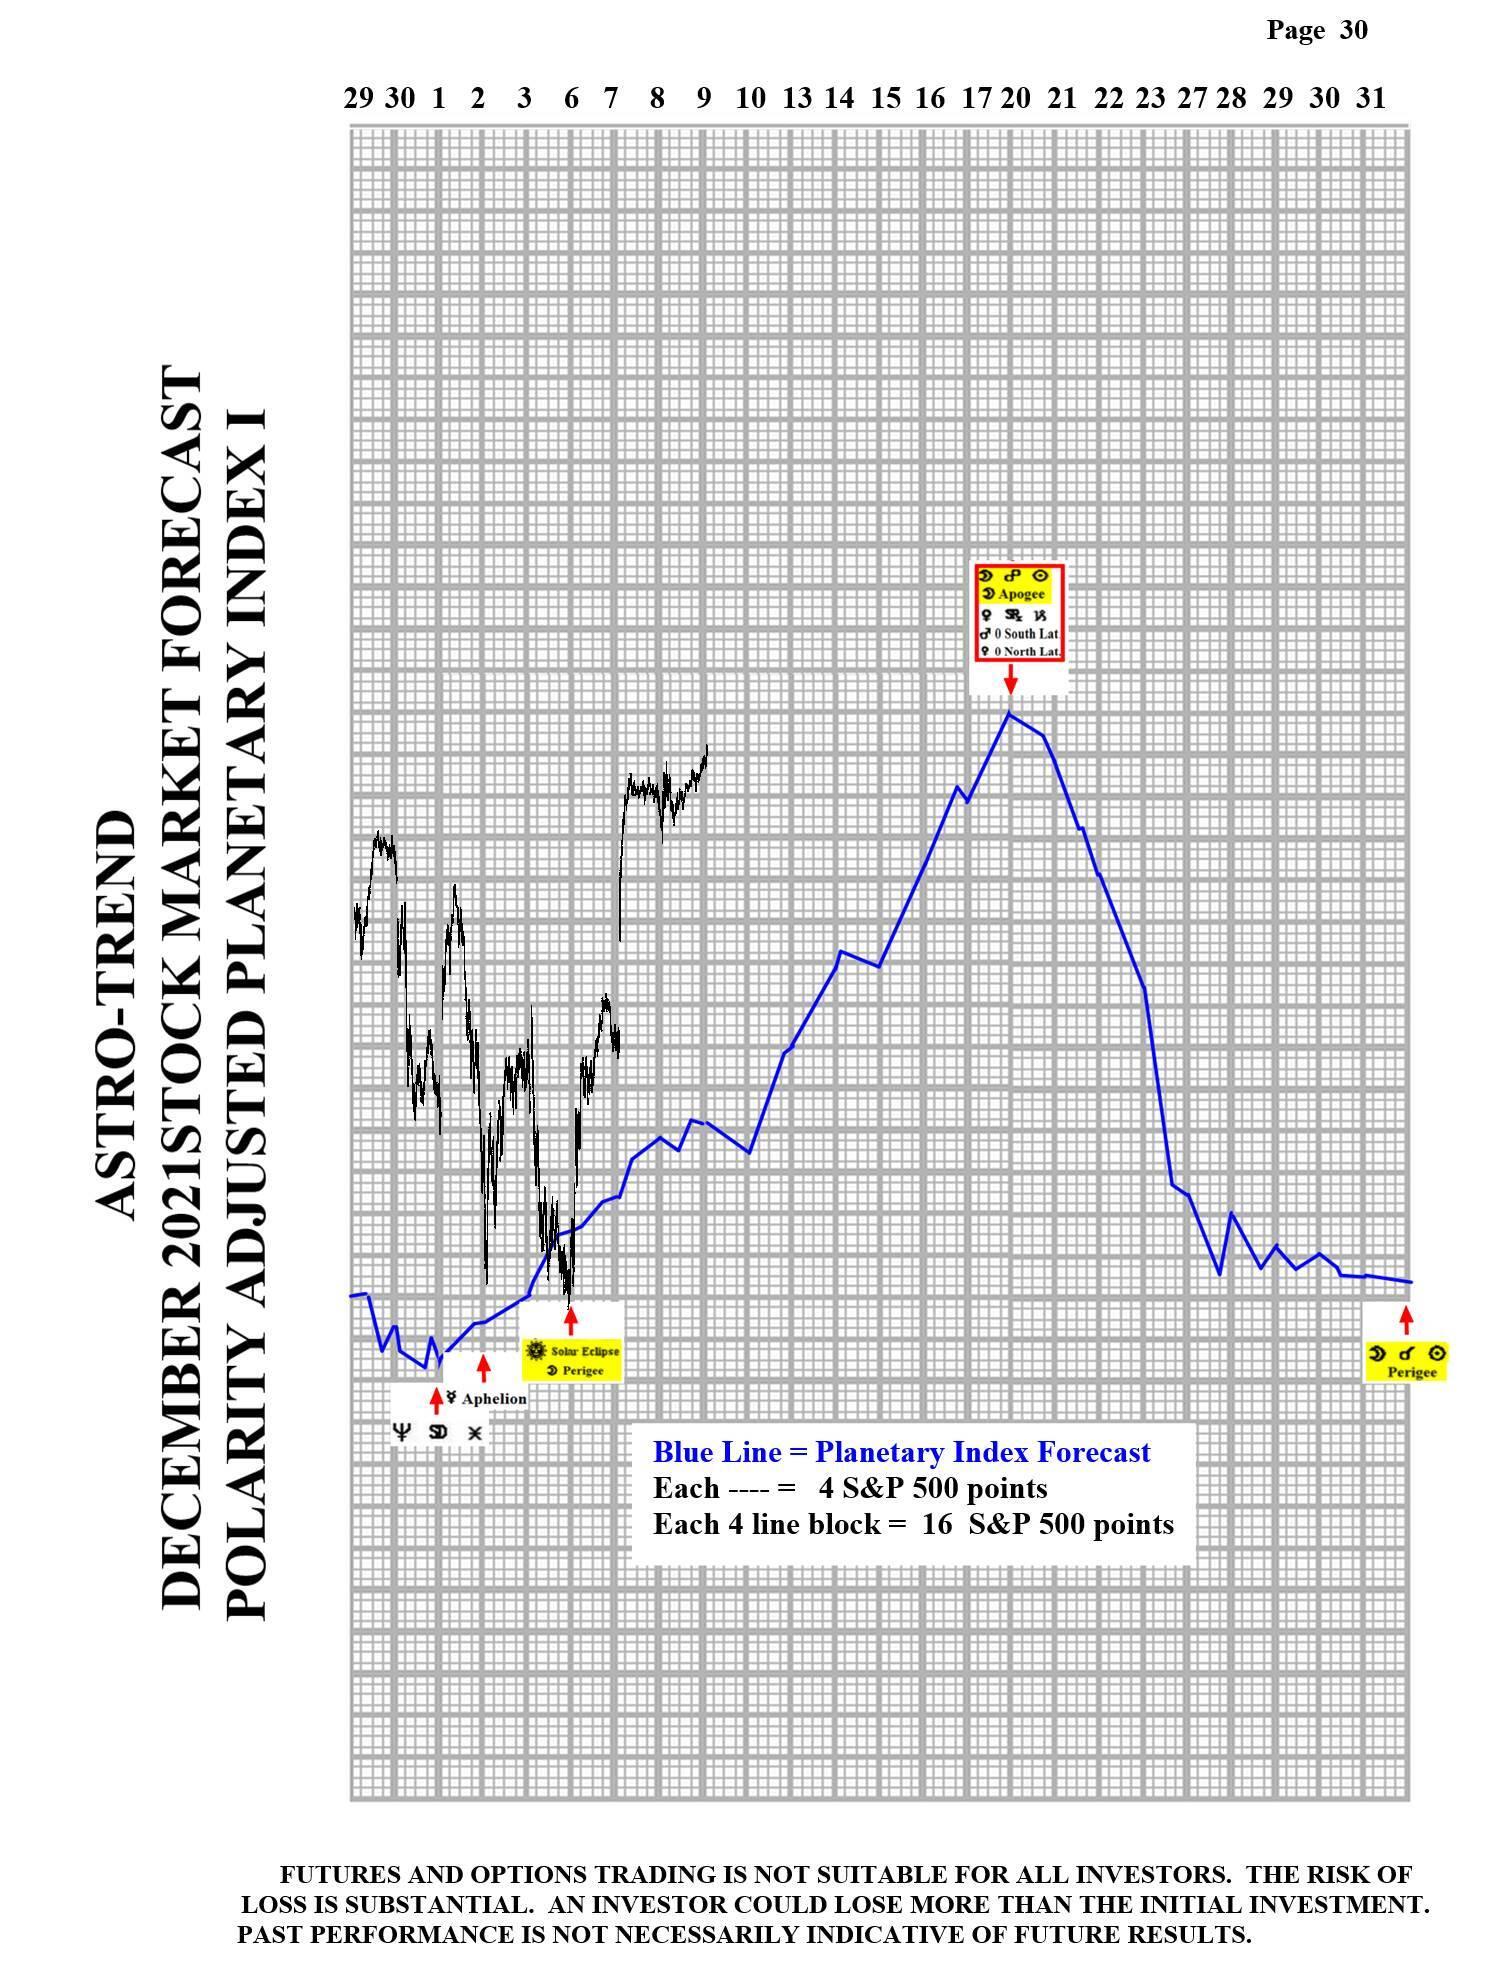
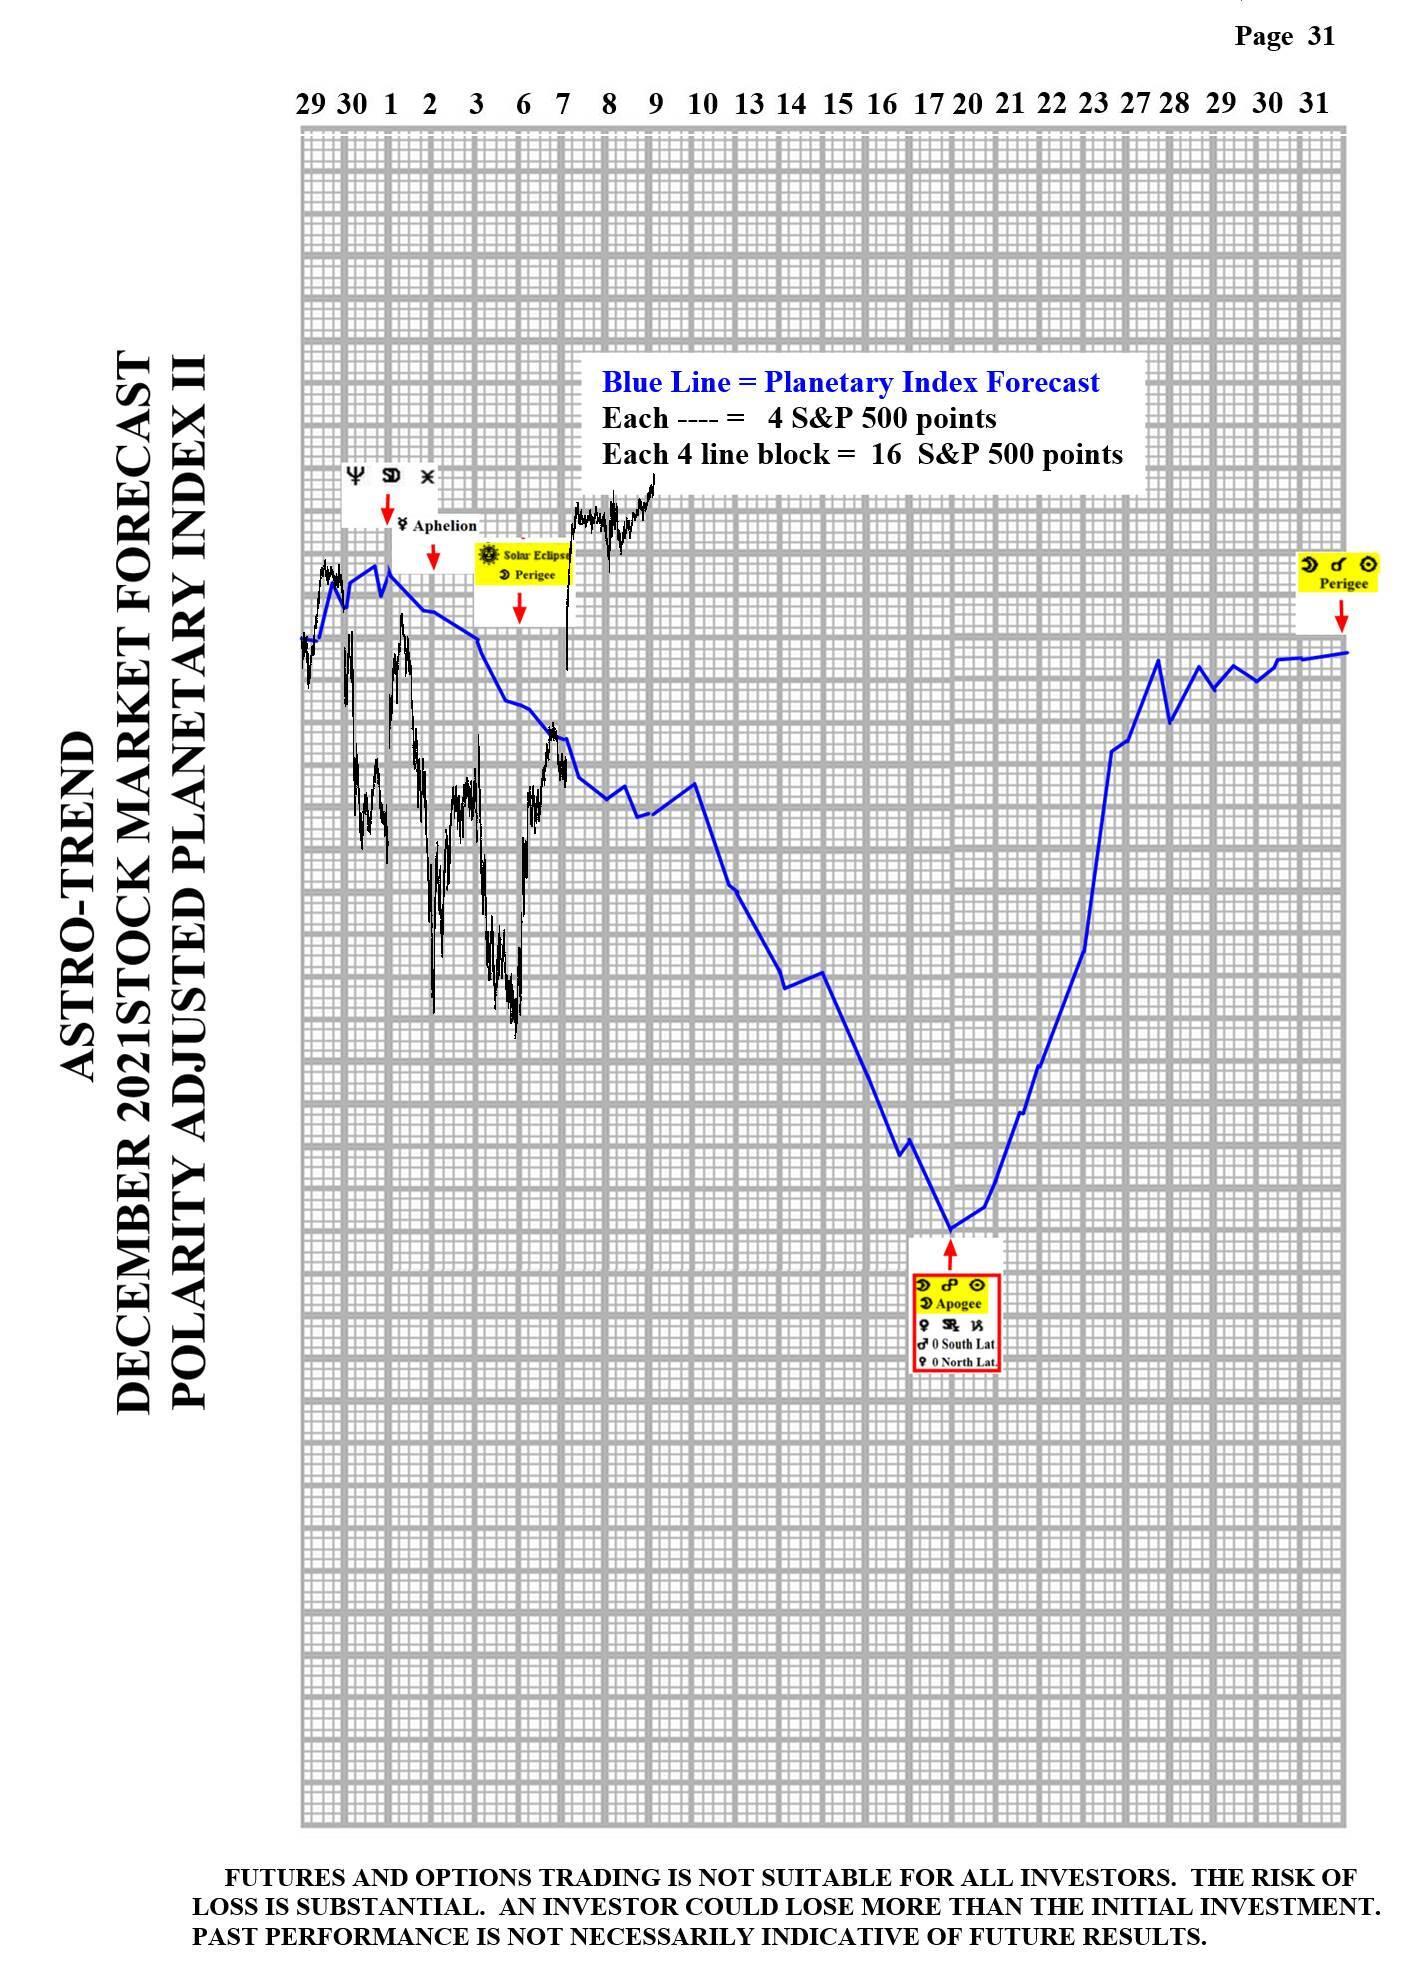
Please see below the Planetary Index charts with S&P 500 5 minute bars for results.

Chart
Chart
Chart
Chart

Author

Norm Winski

Norm Winski

Independent Analyst

www.astro-trend.com

More from Norm Winski
Share:

Editor's Picks

EUR/USD climbs to daily highs on US CPI

EUR/USD now accelerates it rebound and flirts with the 1.1880 zone on Friday, or daily highs, all in response to renewed selling pressure on the US Dollar. In the meantime, US inflation figures showed the headline CPI rose less than expected in January, removing some tailwinds from the Greenback’s momentum.

GBP/USD clings to gains above 1.3600

GBP/USD reverses three consecutive daily pullbacks on Friday, hovering around the low-1.3600s on the back of the vacillating performance of the Greenback in the wake of the release of US CPI prints in January. Earlier in the day, the BoE’s Pill suggested that UK inflation could settle around 2.5%, above the bank’s goal.

Gold: Upside remains capped by $5,000

Gold is reclaiming part of the ground lost on Wednesday’s marked retracement, as bargain-hunters seem to have stepped in. The precious metal’s upside, however, appears limited amid the slightly better tone in the US Dollar after US inflation data saw the CPI rise less than estimated at the beginning of the year.

Crypto Today: Bitcoin, Ethereum, XRP in choppy price action, weighed down by falling institutional interest 

Bitcoin's upside remains largely constrained amid weak technicals and declining institutional interest. Ethereum trades sideways above $1,900 support with the upside capped below $2,000 amid ETF outflows.

Week ahead – Data blitz, Fed Minutes and RBNZ decision in the spotlight

US GDP and PCE inflation are main highlights, plus the Fed minutes. UK and Japan have busy calendars too with focus on CPI. Flash PMIs for February will also be doing the rounds. RBNZ meets, is unlikely to follow RBA’s hawkish path.

Solana Price Forecast: Mixed market sentiment caps recovery

Solana (SOL) is trading at $79 as of Friday, following a correction of over 9% so far this week. On-chain and derivatives data indicates mixed sentiment among traders, further limiting the chances of a price recovery.