Markets Take a Break for New Years
Good Morning Traders,
As of this writing 4:05 AM EST, here’s what we see:
US Dollar: Mar. USD is Up at 103.050.
Energies: February Crude is Up at 54.27.
Financials: The Mar 30 year bond is Down 19 ticks and trading at 150.02.
Indices: The March S&P 500 emini ES contract is 54 ticks Higher and trading at 2249.75.
Gold: The February gold contract is trading Up at 1152.60. Gold is 9 ticks Higher than its close.
Initial Conclusion
This is not a correlated market. The dollar is Up+ and crude is Up+ which is not normal but the 30 year bond is trading Down-. The Financials should always correlate with the US dollar such that if the dollar is lower then bonds should follow and vice-versa. The indices are Up+ and Crude is trading Up+ which is not correlated. Gold is trading Up which is not correlated with the US dollar trading Up. I tend to believe that Gold has an inverse relationship with the US Dollar as when the US Dollar is down, Gold tends to rise in value and vice-versa. Think of it as a seesaw, when one is up the other should be down. I point this out to you to make you aware that when we don’t have a correlated market, it means something is wrong. As traders you need to be aware of this and proceed with your eyes wide open.
Asia traded mainly higher with the exception of the Japanese Nikkei exchange which traded lower. As of this writing all of Europe is trading higher.
Possible Challenges To Traders Today
– Final Manufacturing PMI is out at 9:45 AM EST. This is major.
– ISM Manufacturing PMI is out at 10 AM EST. This is major.
– Construction Spending m/m is out at 10 AM EST. This is major.
– ISM Manufacturing Prices is out at 10 AM EST. This is major.
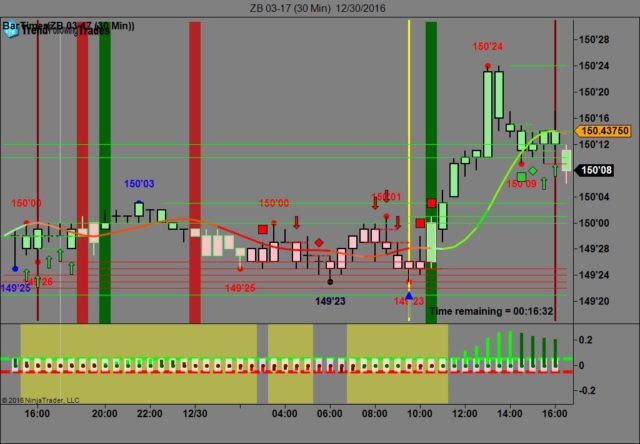
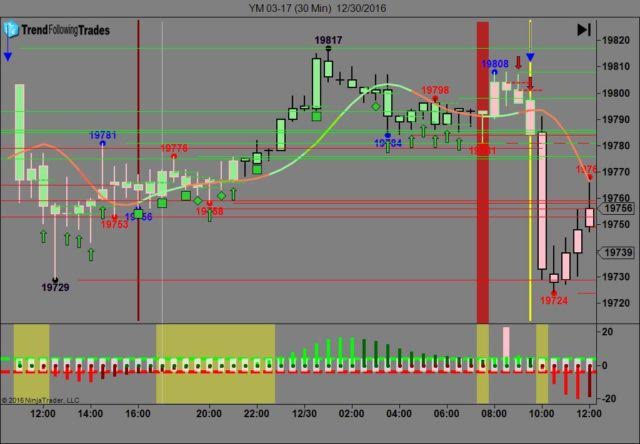
Treasuries
We’ve elected to switch gears a bit and show correlation between the 30 year bond (ZB) and The YM futures contract. The YM contract is the DJIA and the purpose is to show reverse correlation between the two instruments. Remember it’s liken to a seesaw, when up goes up the other should go down and vice versa.
Last Friday the ZB made it’s move at around 9:30 AM EST right around the time the market opened. The ZB hit a low at around that time and the YM hit a high. If you look at the charts below ZB gave a signal at around 9:30 AM EST and the YM was moving higher at the same time. Look at the charts below and you’ll see a pattern for both assets. ZB hit a low at around 9:30 AM EST and the YM hit a high. These charts represent the newest version of Trend Following Trades and I’ve changed the timeframe to a 30 minute chart to display better. This represented a long opportunity on the 30 year bond, as a trader you could have netted about 30 plus ticks per contract on this trade. Each tick is worth $31.25. We added a Donchian Channel to the charts to show the signals more clearly.
Charts Courtesy of Trend Following Trades built on a NinjaTrader platform.
Bias
Last Friday we gave the markets an upside bias as the USD and the Bonds were trading down Friday morning and usually this indicative of an upside trend. The markets however had other ideas with the Dow dropping 57 points and the other indices losing ground as well. Today we aren’t dealing with a correlated market and our bias is to the upside.
Could this change? Of Course. Remember anything can happen in a volatile market.
Commentary
So what happened last Friday? Why did the markets drop? Each and every time we get close to the proverbial 20,000 level the markets seem to retreat. Last Friday was the last trading day for 2016 but it was also the last trading day prior to a major holiday. So what happened? Typically on the last trading day before a major holiday the Smart Money (institutionals) like to head for the exit doors early with the mentality of “I’ve already made my money for the year” and they aren’t too concerning about the rest of the trading session. Today is the first trading day of 2017 and I typically never place trades on the first trading day of the New Year as you never know what the institutionals will do. Today we do have major economic news that could move the markets, we’ll have to monitor and see…
Author

Nick Mastrandrea
Market Tea Leaves


