USD/JPY Current price: 123.93
View Live Chart for the USD/JPY
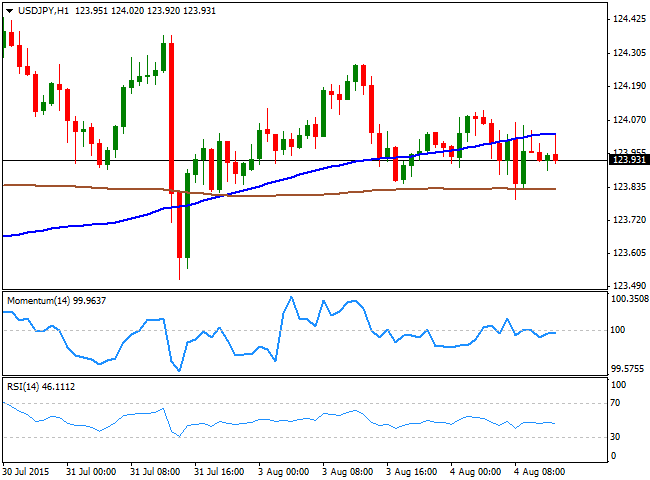
Still waiting for a trigger. The USD/JPY pair remains within a restricted intraday range below the 124.00 level, with short lived spikes above the figure being quickly rejected. The 1 hour chart shows that the price continues hovering between its 100 and 200 SMAs, albeit the technical indicators present a mild negative tone suggesting the pair may extend its decline in the short term, particularly on a break below 123.70 the immediate support, in route to the 123.30 level. In the 4 hours chart the price is holding above its 100 SMA, but the technical indicators are also heading south below their mid-lines, supporting the shorter term view. Advances up to 124.45 should be seen as short term selling opportunities, as only a clear break above the level will support the upside.
Support levels: 123.70 123.30 122.90
Resistance levels: 124.45 124.90 125.30
Recommended Content
Editors’ Picks
AUD/USD retargets the 0.6600 barrier and above

AUD/USD extended its positive streak for the sixth session in a row at the beginning of the week, managing to retest the transitory 100-day SMA near 0.6580 on the back of the solid performance of the commodity complex.
EUR/USD keeps the bullish bias above 1.0700

EUR/USD rapidly set aside Friday’s decline and regained strong upside traction in response to the marked retracement in the Greenback following the still-unconfirmed FX intervention by the Japanese MoF.
Gold advances for a third consecutive day

Gold fluctuates in a relatively tight channel above $2,330 on Monday. The benchmark 10-year US Treasury bond yield corrects lower and helps XAU/USD limit its losses ahead of this week's key Fed policy meeting.
Bitcoin price dips to $62K range despite growing international BTC validation via spot ETFs

Bitcoin (BTC) price closed down for four weeks in a row, based on the weekly chart, and could be on track for another red candle this week. The last time it did this was in the middle of the bear market when it fell by 42% within a span of nine weeks.
Japan intervention: Will it work?

Dear Japan Intervenes in the Yen for the first time since November 2022 Will it work? Have we seen a top in USDJPY? Let's go through the charts.