Is the Topping Process in Motion? Key Divergences Starting to Form

In the last update I sent a while back, I was looking for either a top by mid- to late October or the beginning of a topping process into December or January. By the looks of things, it seems that second scenario is unfolding.
My co-author on the new book, Zero Hour (out next Tuesday), Andrew Pancholi, also identified the largest ever turn point in his markettimingreport.com newsletter. He pinned that turn point to mid-October.
Now that we’re in the second week of November, a lot of his subscribers are wondering whether he was wrong. After all, many indices from the Nasdaq to the Dow continue to edge up.
The thing is, turning points don’t always turn on a dime. More often than not, the current will start shifting close to the indicated turning point, but it can take months for the effects to be seen and felt! And the bigger the turning point, the subtler the shift and the longer to play out.
I don’t think Andy is wrong. With each divergence I’m seeing starting to form right now, I think we’re increasingly looking at a major topping process – one that started on the date of Andy’s major turn point – and it’s going to take a few months to unfold.
I’ll illustrate my point with four examples…
Before I do that though, I want to make a distinction between momentum tops or bottoms and actual tops or bottoms, which tend to go just a bit higher or lower.
In the 1987 bubble, the momentum top was in August, but the market moved sideways and only crashed in October – two months later. Claiming a missed turning point because the crash didn’t happen in August is like claiming that golfer Scott Langley didn’t make the putt on the 16th hole back in June 2014 because his ball hung on the lip for 22 seconds!
The 2000 tech bubble top saw the momentum top on January 14, where the Dow topped, and the broader top on the Nasdaq on March 10. Then the first sharp crash of 40% hit into late May.
Andy’s model had its second strongest turn point ever in late 2002, right near the momentum bottom of the crash on July 23. That day, the Dow bottomed intraday at 7,683. Then there was a bounce. The final bottom was only reached on October 9, at 7,282 (5% lower).
That turn signal would have been a great buy opportunity because the markets more than doubled over the next five years!
BUT, it took two and a half months to unfold fully.
The last example is of the top in 2007. There was a momentum top for the S&P 500 on July 19, at 1,555, then a 10% correction, and a final top just barely higher on October 9, at 1,565 (just 0.6% higher). The small caps didn’t make a new high in October and that was a key divergence that signaled such a major top.
My point is obvious: it takes time to move a massive shift. It takes time for the wave to roll ashore, especially when we are looking at a major long-term top or bottom!
As I said, Andy’s model had the largest turn point – due in mid-October – that his model has ever registered.
So, what is happening here? The wave may be building as it rolls toward us.
Look at this chart…
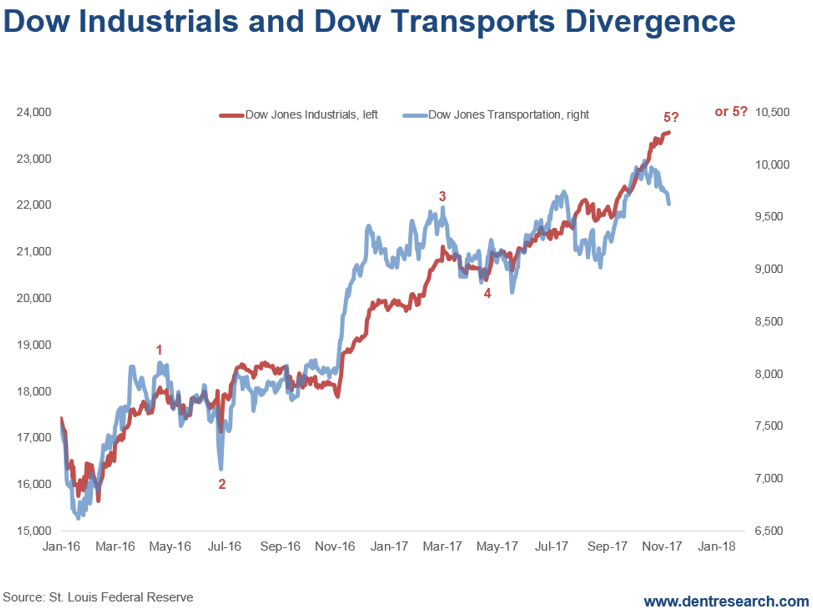
The Dow Transports are down 4.5% since a top on October 12, while the Dow Industrials are up another 3%.
That looks like a classic “Dow Theory” divergence in the making.
The Russell 2000 small caps peaked on October 5 at 1,515 and have not yet made a new high to confirm the slight new highs in the Dow, S&P 500, and Nasdaq recently.
This is another major divergence we could be witnessing.
I think we’re approaching the major long-term top that Andy and I have been looking for, and which we talk about in Zero Hour.
I think that wave is coming.
The ideal scenario would be to see a more minor correction into November, and then a rally into December or mid- to late January (when Andy has his next major turn point) without new highs in the Dow Transports or Russell 2000 small caps. Then we could see the great crash begin.
This is not certain yet, of course, but it looks likely…
So, hang tight. We’ll keep you updated.
Author

Harry S. Dent, MBA
Dent Research
Harry S. Dent Jr. studied economics in college in the ’70s, but found it vague and inconclusive. He became so disillusioned by the state of his chosen profession that he turned his back on it.


