![]()
Two weeks ago, we discussed how US companies were performing midway through Q3 earnings season, characterizing the results so far as “mixed.†Now that nearly 90% (444) of the companies in the S&P 500 have reported earnings, we wanted to revisit that analysis, especially in the light of the more hawkish Federal Reserve and last week’s stellar October jobs report.
Thus far, 74% of the reporting companies have beaten their consensus earnings estimates; As we noted two weeks ago, this number sounds incredibly encouraging, but it’s worth noting that the 1-year and 5-year averages for this figure are 74% and 72% respectively, so it’s essentially in-line with the recent historical figures.
Meanwhile, only 46% of reporting companies have beat analysts’ expectations on top-line sales, which is a more difficult measure to “massage†in-line with the market’s forecasts. This reading is well below both the 1-year (53%) and 5-year (57%) averages, signaling that US companies continue to cut costs aggressively and exploit accounting gimmicks in order to overcome weak overall global growth.
According to the earnings mavens at FactSet, the “blended†earnings decline, which combines companies that have reported with the estimates for companies yet to report, is -2.2% for the quarter. If this measure holds, we would see the first back-to-back earnings decline since 2009, in the midst of the Great Financial Crisis.
Of course, the top-level summary data hides much of the variation within the index itself. In terms of sector-level themes, sales in the Energy (-35.6%) and Materials (-13.6%) sectors have been especially weak amidst the deep bear market in oil and other commodity prices. Meanwhile, the Telecom and Health Care sectors have seen the strongest sales growth at 11.8% and 9.3% respectively. Companies with substantial international exposure have generally struggled against the headlines of the strengthening dollar.
Market Reaction
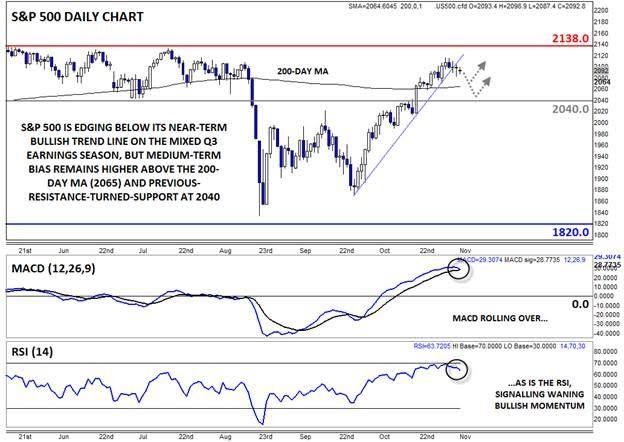
Taking a look at the chart, the S&P 500 continues to grind higher, with the index peeking briefly above 2100 last week. Bulls will no doubt be tempted to push the index up to its all-time high near 2140, but there are some signs that the rally may be losing steam in the short term. To that end, the index broke its (admittedly unsustainably steep) bullish trend line off the late September lows and on Friday, and both the MACD and RSI indicators are showing signs of rolling over, indicating fading bullish momentum.
While a short-term pullback is looking increasingly likely, we would expect support to emerge near the 200-day MA (2060) or previous-resistance-turned-support at 2040. A dip toward these levels could present an opportunity for traders to join the medium-term uptrend at value.
This research is for informational purposes and should not be construed as personal advice. Trading any financial market involves risk. Trading on leverage involves risk of losses greater than deposits.
Recommended Content
Editors’ Picks
AUD/USD regains the constructive outlook above the 200-day SMA

AUD/USD advanced strongly for the second session in a row, this time extending the recovery to the upper 0.6500s and shifting its focus to the weekly highs in the 0.6580-0.6585 band, an area coincident with the 100-day SMA.
EUR/USD keeps the bullish performance above 1.0700

The continuation of the sell-off in the Greenback in the wake of the FOMC gathering helped EUR/USD extend its bounce off Wednesday’s lows near 1.0650, advancing past the 1.0700 hurdle ahead of the crucial release of US NFP on Friday.
Gold stuck around $2,300 as market players lack directional conviction

Gold extended its daily slide and dropped below $2,290 in the second half of the day on Thursday. The benchmark 10-year US Treasury bond yield erased its daily losses after US data, causing XAU/USD to stretch lower ahead of Friday's US jobs data.
Bitcoin price rises 5% as BlackRock anticipates a new wave of capital inflows into BTC ETFs from investors

Bitcoin (BTC) price slid to the depths of $56,552 on Wednesday as the cryptocurrency market tried to front run the Federal Open Market Committee (FOMC) meeting. The flash crash saw millions in positions get liquidated.
FOMC in the rear-view mirror – NFP eyed

The update from May’s FOMC rate announcement proved more dovish than expected, which naturally weighed on the US dollar (sending the DXY to lows of 105.44) and US yields, as well as, initially at least, underpinning major US equity indices.
