![]()
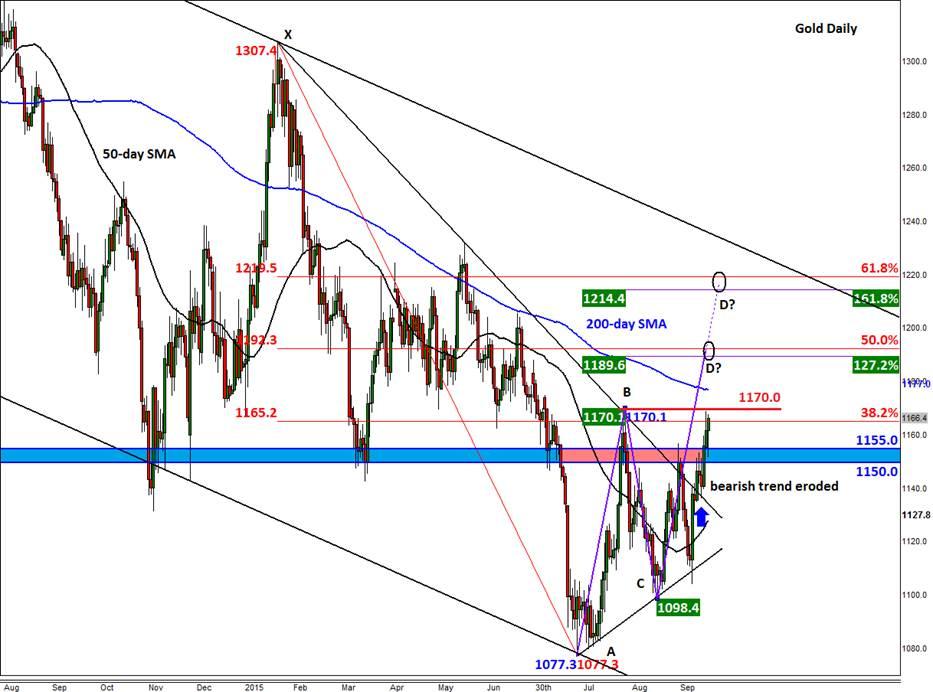
Unlike crude oil, gold has been able to hold its own pretty well so far this week. At the time of this writing on Tuesday evening, the precious metal was trading around $1165 per troy ounce after recovering its earlier losses. It was thus 5 bucks shy of the key short-term resistance and August high at $1170.
The precious metal is continuing to benefit from the weakness in US dollar and safe haven buying due to growing uncertainty about the direction of the stock markets. The US earnings season is about to kick into a higher gear this week with the major Wall Street banks reporting their quarterly results over the next few days; the fear is that the banks and other US companies may disappoint the already-low expectations. Meanwhile concerns over the health of the Chinese economy may also undermine risk appetite after the latest trade figures showed imports at the world’s second largest economy fell more than 20% year-over-year in September. In addition, gold has caught the attention of momentum speculative buyers after the precious metal broke above a key resistance level and a long-term downward-sloping trend line around $1140 last week; this is technical bullish development.
So, as things stand gold is shining brightly and looks like it wants to push further higher this week, US data permitting. Although there wasn’t much in the way of US macroeconomic data on Tuesday, things should pick up from Wednesday onwards when we will have the latest retail sales and PPI figures. Thursday will see the release of the monthly headline and core CPI estimates; the Empire State and Philly Fed manufacturing indices, and the usual weekly unemployment claims figures. Friday’s key macro data will include the UoM Consumer Sentiment, JOLTS Job Openings, Industrial Production and Capacity Utilization Rate. So, there will be plenty of data this week to hopefully provide clear direction for the dollar and in turn the buck-denominated precious metal.
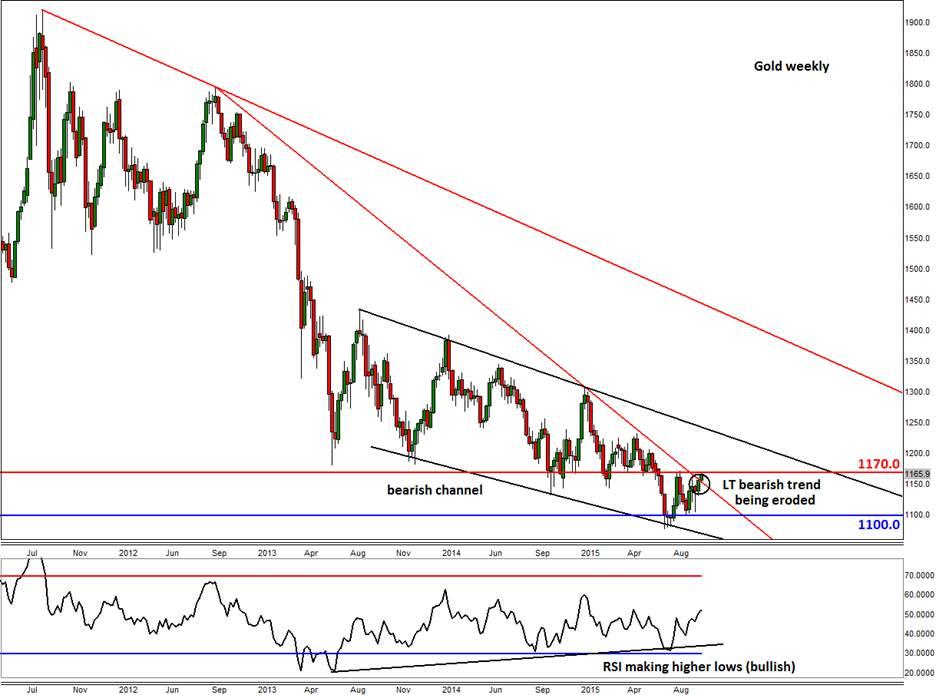
From a technical perspective, the break of the long-term trend line is clearly a bullish development for gold (see the weekly chart). That being said, the precious metal still resides within a bearish channel, and will remain inside it even if it goes on to break above the short-term resistance at $1170. Nevertheless, the potential break above $1170 could at least lead to some further short-term gains, and who knows it could even mark the start of a major bullish trend. For the time being though, the bulls should proceed with extra caution and should avoid the temptation to project their expectations about the direction of prices too far out, as this can be quite dangerous and lead to all sorts of problems down the line. Many times traders fail to do what is in their own best interest because price action simply does not follow the path they had envisaged at the time when they first placed their trades.
A potential break above the noted $1170 resistance level, especially on a daily closing basis, could see the metal go for the 200-day moving average at $1177 at the very least and possibly even the Fibonacci convergence levels around $1189/92 and then $1214/20 (these areas are circled on the daily chart). The resistance trend of the long-term bearish channel would also come in around the $1220 level, depending on the speed of the potential rally. Meanwhile this bullish technical outlook will become invalid upon a decisive break back below the $1150 handle. In this scenario, gold may then drop back towards its 50-day SMA, currently at $1128, before deciding on its next move.
Figure 1:
Figure 2:
Trading leveraged products such as FX, CFDs and Spread Bets carry a high level of risk which means you could lose your capital and is therefore not suitable for all investors. All of this website’s contents and information provided by Fawad Razaqzada elsewhere, such as on telegram and other social channels, including news, opinions, market analyses, trade ideas, trade signals or other information are solely provided as general market commentary and do not constitute a recommendation or investment advice. Please ensure you fully understand the risks involved by reading our disclaimer, terms and policies.
Recommended Content
Editors’ Picks
AUD/USD: Gains appear capped near 0.6580

AUD/USD made a sharp U-turn on Tuesday, reversing six consecutive sessions of gains and tumbling to multi-day lows near 0.6480 on the back of the robust bounce in the Greenback.
EUR/USD looks depressed ahead of FOMC

EUR/USD followed the sour mood prevailing in the broader risk complex and plummeted to multi-session lows in the vicinity of 1.0670 in response to the data-driven rebound in the US Dollar prior to the Fed’s interest rate decision.
Gold stable below $2,300 despite mounting fears

Gold stays under selling pressure and confronts the $2,300 region on Tuesday against the backdrop of the resumption of the bullish trend in the Greenback and the decent bounce in US yields prior to the interest rate decision by the Fed on Wednesday.
Bitcoin price tests $60K range as Coinbase advances toward instant, low-cost BTC transfers

BTC bulls need to hold here on the daily time frame, lest we see $52K range tested. Bitcoin (BTC) price slid lower on Tuesday during the opening hours of the New York session, dipping its toes into a crucial chart area.
Federal Reserve meeting preview: The stock market expects the worst

US stocks are a sea of red on Tuesday as a mixture of fundamental data and jitters ahead of the Fed meeting knock risk sentiment. The economic backdrop to this meeting is not ideal for stock market bulls.