![]()
During the recent stock market turmoil gold managed to rally sharply as investors sought safe haven assets. Appetite for riskier assets fell in part because of renewed concerns about the health of China, the world’s second largest economy. Concerns were raised following the release of some weaker macroeconomic numbers, including the most recent manufacturing PMI, and the decision by the People’s Bank of China to sharply devalue its currency. The PBOC was at it again today as it further loosened its monetary policy in its latest attempt to shore up confidence and support growth. It cut the benchmark 1-year lending and saving rates by 25 basis points each to 4.6 and 1.75 per cent respectively. In addition, the Reserve Required Ratio (RRR) was dropped by a further 50 basis points. But following an initial positive reactions, stocks soon retreated from their highs. This market behaviour, if sustained, would suggest that either the PBOC's easing measures were already priced in or simply not bold enough. As stocks retreated a little from their best levels, this helped to lift gold from its earlier lows. But given the fact that the metal was unable to benefit from Monday’s stock market crash, we are sceptical about the precious metal’s ability to sustain its recent gains. If Monday’s events were not enough of a reason for the gold bulls to come out en masse then what would it take? Also, the US dollar apparently failed to find much safe haven demand on Monday with the EUR/USD surging higher and USD/JPY tumbling, though it did well against emerging market and commodity currencies. Thus both stocks and the dollar fell. Normally, this combination would have boosted the price of gold, but it didn’t on Monday. This could be a sign of things to come for the remainder of this week, especially if the stock markets stabilise.
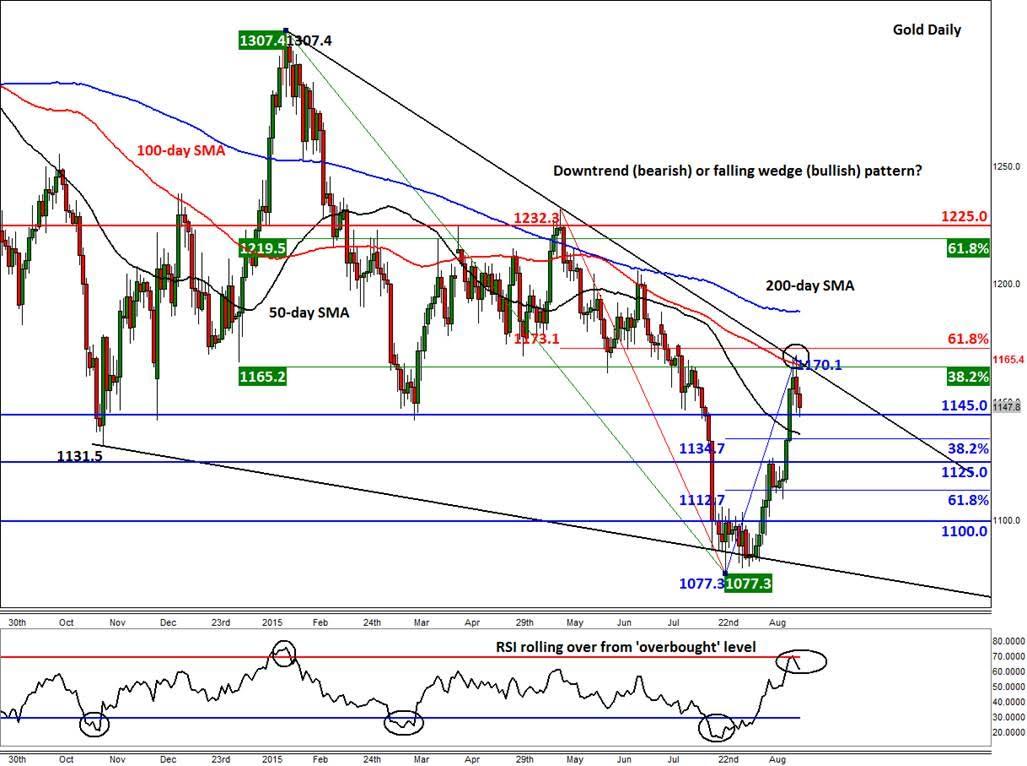
But from a technical point of view, gold’s decline over the past couple of days make some sense. As can be seen from the chart, the precious metal has come under pressure because of the concentration of several technical factors around the $1165/70 area. Here, the 100-day moving average meets a medium-term bearish trend line and the 38.2% Fibonacci retracement of the downswing from the 2015 high that was achieved in January at $1307. Thus it is likely that the bulls took some profit here and some bears re-entered at better levels.
At the time of this writing, gold is testing support $1145, a level which had been support and resistance in the past. If the bears manage to push gold below this level on a closing basis then we could see further losses in the days to come. Otherwise, a rally back towards, and potentially beyond, the $1165/70 area could be on the cards. The next potential level of support is around $1135/6; this is where the 38.2% Fibonacci retracement of the recent up move meets the 50-day moving average. Further supports could be around $1125 or the 61.8% Fibonacci level at $1112/3. On the upside, a break above the aforementioned $1165/70 resistance area would technically be very bullish. That’s because it would also confirm the break out from a potential falling wedge bullish pattern. That being said, gold does tend to respond very well to the 61.8% Fibonacci level, which hasn’t been tested yet for the shorter-term downswing that began in May, at $1173. Thus a decisive break above the $1173 level is needed in order for the metal go for the 200-day moving average at $1188 or the 61.8% retracement level of the larger swing around $1220, before deciding on its next move.
Trading leveraged products such as FX, CFDs and Spread Bets carry a high level of risk which means you could lose your capital and is therefore not suitable for all investors. All of this website’s contents and information provided by Fawad Razaqzada elsewhere, such as on telegram and other social channels, including news, opinions, market analyses, trade ideas, trade signals or other information are solely provided as general market commentary and do not constitute a recommendation or investment advice. Please ensure you fully understand the risks involved by reading our disclaimer, terms and policies.
Recommended Content
Editors’ Picks
AUD/USD: Gains appear capped near 0.6580

AUD/USD made a sharp U-turn on Tuesday, reversing six consecutive sessions of gains and tumbling to multi-day lows near 0.6480 on the back of the robust bounce in the Greenback.
EUR/USD looks depressed ahead of FOMC

EUR/USD followed the sour mood prevailing in the broader risk complex and plummeted to multi-session lows in the vicinity of 1.0670 in response to the data-driven rebound in the US Dollar prior to the Fed’s interest rate decision.
Gold stable below $2,300 despite mounting fears

Gold stays under selling pressure and confronts the $2,300 region on Tuesday against the backdrop of the resumption of the bullish trend in the Greenback and the decent bounce in US yields prior to the interest rate decision by the Fed on Wednesday.
Bitcoin price tests $60K range as Coinbase advances toward instant, low-cost BTC transfers

BTC bulls need to hold here on the daily time frame, lest we see $52K range tested. Bitcoin (BTC) price slid lower on Tuesday during the opening hours of the New York session, dipping its toes into a crucial chart area.
Federal Reserve meeting preview: The stock market expects the worst

US stocks are a sea of red on Tuesday as a mixture of fundamental data and jitters ahead of the Fed meeting knock risk sentiment. The economic backdrop to this meeting is not ideal for stock market bulls.
