![]()
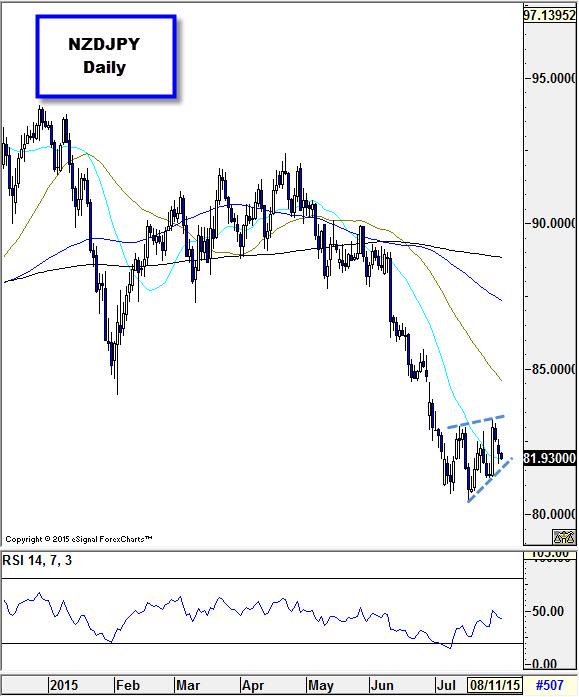
NZDJPY peaked just above 94.00 at the end of 2014, before plummeting in January and again in June. The totality of the sell-off was almost 1,400 at its lowest point, despite gains in USDJPY. It was a widespread and a brutal sell-off in the kiwi that derailed the pair, with the commodity currency coming under assault from weaker commodity prices, soft risk appetite and a deteriorating outlook for interest rates.
Bears don’t appear to have finished feasting on the kiwi just yet, as evidenced by a very soft business confidence index for NZ today, and now the yen is starting to look a little more comfortable pushing higher than it has in the past. Policy setters in Japan appear to becoming more uncomfortable with the negative impacts of excessive policy loosening and yen weakness and Japanese economic data may be turning a corner.
Industrial production in Japan jumped an impressive 0.8% m/m in June and inflation is not as bad as once feared, with core CPI rising 0.1% y/y last month (expected 0.0%). It’s still very early days in Japan and we aren’t ruling out the prospect of further stimulus from the BoJ, but there’s at least a glimpse of light on the horizon for the economy, however dim. This was reflected by a jump in the yen on the back of today’s inflation figures, with USDJPY briefly shooting below 124.00
In New Zealand, ANZ’s Business Confidence Index dropped to -15.3 this month, representing an astounding deterioration of corporate sentiment. This is the lowest the index has been in over six years and the first time it has been in contraction territory twice in a row since the GFC. Unsurprisingly, the kiwi didn’t react very well to this news, with NZDUSD dropping through 0.6600 before finding some support around 0.6570.
NZDJPY
NZDJPY’s recent push upwards looks more like a consolidation than the beginning of a more substantial push higher. At present, the pair is testing the bottom of this channel, a break of which could see the pair make another run at support around 80.50. On the up side, we’re keeping an eye on the top of its wedge formation and then a key sticky zone for price around 85.00.

Source: FOREX.comSource: FOREX.com
Recommended Content
Editors’ Picks
AUD/USD: Uptrend remains capped by 0.6650

AUD/USD could not sustain the multi-session march north and faltered once again ahead of the 0.6650 region on the back of the strong rebound in the Greenback and the prevailing risk-off mood.
EUR/USD meets a tough barrier around 1.0800

The resurgence of the bid bias in the Greenback weighed on the risk-linked assets and motivated EUR/USD to retreat to the 1.0750 region after another failed attempt to retest the 1.0800 zone.
Gold eases toward $2,310 amid a better market mood

After falling to $2,310 in the early European session, Gold recovered to the $2,310 area in the second half of the day. The benchmark 10-year US Treasury bond yield stays in negative territory below 4.5% and helps XAU/USD find support.
Bitcoin price coils up for 20% climb, Standard Chartered forecasts more gains for BTC

Bitcoin (BTC) price remains devoid of directional bias, trading sideways as part of a horizontal chop. However, this may be short-lived as BTC price action consolidates in a bullish reversal pattern on the one-day time frame.
What does stagflation mean for commodity prices?

What a difference a quarter makes. The Federal Reserve rang in 2024 with a bout of optimism that inflation was coming down to their 2% target. But that optimism has now evaporated as the reality of stickier-than-expected inflation becomes more evident.