![]()
NZDJPY bulls overpower the bears
However, this began to change earlier this month with the release of some encouraging economic data from NZ. On the same day that the GlobalDairyTrade Price Index recorded a reassuring 9.4% jump, Statistics New Zealand released an encouraging Q4 employment report. Employment increased 1.2% q/q and people flocked back into the labour force.
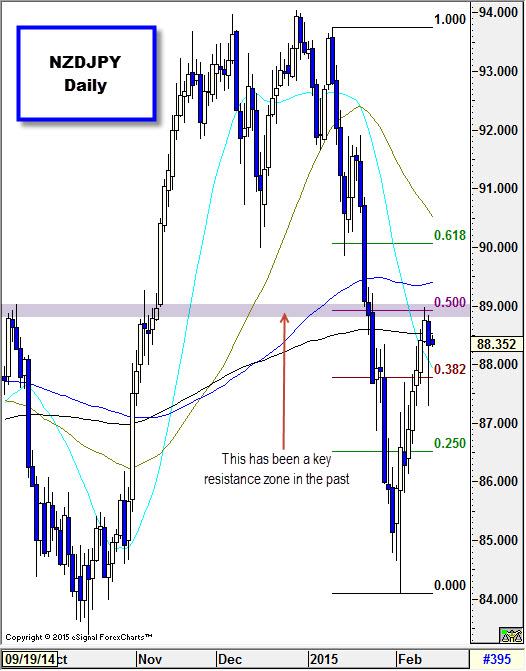
This helped to spark a rally in NZDJPY which sent the pair around 500 pips higher at its highest point. However, the rally ran out of steam about halfway to where the aforementioned sell-off began, which also happens to coincide with an important long-term resistance zone (see chart). A rejection here may mean that price is losing upward momentum. In fact, it has already started to drift lower.
Uncertainty has trapped NZDJPY
It looks like uncertainty has killed the pair. The market is still trying to figure what the RBNZ’s next move will be and when. There is also the question of whether the BoJ will pump even more stimulus into the economy; we expect the BoJ to hold off in the near-term but if inflation continues to falter in Japan the BoJ won’t hesitate to expand its already massive QQE program. With the outlook for monetary policy in Japan and NZ up the air at the moment, NZDJPY has lost its engine and it’s no surprise that NZDJPY’s retracement has stalled and some techs have turned negative, thus our bias is lower at the moment.

Source: FOREX.com
Recommended Content
Editors’ Picks
AUD/USD: Uptrend remains capped by 0.6650

AUD/USD could not sustain the multi-session march north and faltered once again ahead of the 0.6650 region on the back of the strong rebound in the Greenback and the prevailing risk-off mood.
EUR/USD meets a tough barrier around 1.0800

The resurgence of the bid bias in the Greenback weighed on the risk-linked assets and motivated EUR/USD to retreat to the 1.0750 region after another failed attempt to retest the 1.0800 zone.
Gold eases toward $2,310 amid a better market mood

After falling to $2,310 in the early European session, Gold recovered to the $2,310 area in the second half of the day. The benchmark 10-year US Treasury bond yield stays in negative territory below 4.5% and helps XAU/USD find support.
Bitcoin price coils up for 20% climb, Standard Chartered forecasts more gains for BTC

Bitcoin (BTC) price remains devoid of directional bias, trading sideways as part of a horizontal chop. However, this may be short-lived as BTC price action consolidates in a bullish reversal pattern on the one-day time frame.
What does stagflation mean for commodity prices?

What a difference a quarter makes. The Federal Reserve rang in 2024 with a bout of optimism that inflation was coming down to their 2% target. But that optimism has now evaporated as the reality of stickier-than-expected inflation becomes more evident.