![]()
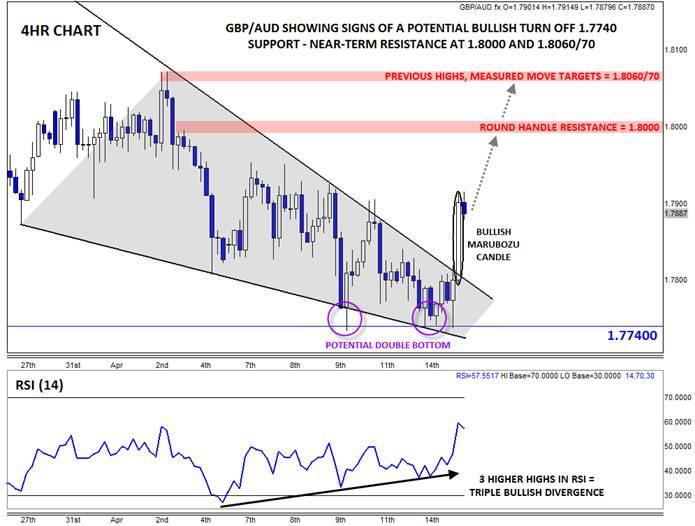
Nearly a month ago, we highlighted the uncanny convergence of multiple bearish technical signals (see “GBP/AUD: Six Technical Signs of a Longer-Term Top” for more). Since then, the GBP/AUD has collapsed around 400 pips, and though we still haven’t reached the intermediate target near 1.7600, there is a growing body of technical evidence that suggests the pair may have seen a near-term bottom.
First, and perhaps most importantly, rates have broken above the bearish trend line off the March 3rd high (the “right shoulder” of the daily head-and-shoulders pattern, not shown). In general, a broken trend line signals a change in trend, though not necessarily a reversal of the previous trend; for example, prices may simply start to “trend” sideways below 1.80 from here, so traders may want to look for further evidence before immediately buying the pair or closing longer-term shorts.
Digging deeper though, the recent technical patterns are showing nascent signs of a shift to a bullish trend. For one, connecting the lows since late March reveals a falling wedge pattern on the 4hr chart – with today’s big breakout, this pattern points to a possible recovery rally back above 1.80. The pair’s RSI also put in a triple bullish divergence with price, indicating waning bearish momentum and increasing the likelihood of a medium-term bottom in the pair.
On a candlestick perspective, the GBP/AUD just put in a large 4h Bullish Marubozu Candle*, which shows strong buying pressure throughout today’s early US session and foreshadows a potential continuation to the topside over the next few candles. Finally, the recent low came in near the same area as last Thursdays low, raising the possibility of a double bottom pattern that would be confirmed by a conclusive break above 1.7900.
Before turning outright bullish, traders should note that the pair still remains in a general downtrend (lower lows and lower highs) on the daily chart. That said, near-term bullish traders may want to watch for a bounce back toward the psychologically-significant 1.80 level, followed by a potential continuation toward the upper-1.8000s, where the measured move targets of the falling wedge and double bottom pattern converge. On the other hand, a drop back below 1.7800 or double bottom support at 1.7740 would turn the bias back to bearish for a possible move down toward 1.7600 support next.
* A Marubozu candle is formed when prices open very near to one extreme of the candle and close very near the other extreme. Marubozu candles represent strong momentum in a given direction.
General Risk Warning for stocks, cryptocurrencies, ETP, FX & CFD Trading. Investment assets are leveraged products. Trading related to foreign exchange, commodities, financial indices, stocks, ETP, cryptocurrencies, and other underlying variables carry a high level of risk and can result in the loss of all of your investment. As such, variable investments may not be appropriate for all investors. You should not invest money that you cannot afford to lose. Before deciding to trade, you should become aware of all the risks associated with trading, and seek advice from an independent and suitably licensed financial advisor. Under no circumstances shall Witbrew LLC and associates have any liability to any person or entity for (a) any loss or damage in whole or part caused by, resulting from, or relating to any transactions related to investment trading or (b) any direct, indirect, special, consequential or incidental damages whatsoever.
Recommended Content
Editors’ Picks
AUD/USD weakens further as US Treasury yields boost US Dollar

The Australian Dollar extended its losses against the US Dollar for the second straight day, as higher US Treasury bond yields underpinned the Greenback. On Wednesday, the AUD/USD lost 0.26% as market participants turned risk-averse. As the Asian session begins, the pair trades around 0.6577.
EUR/USD stuck near midrange ahead of thin Thursday session

EUR/USD is reverting to the near-term mean, stuck near 1.0750 and stuck firmly in the week’s opening trading range. Markets will be on the lookout for speeches from ECB policymakers, but officials are broadly expected to avoid rocking the boat amidst holiday-constrained market flows.
Gold price drops amid higher US yields awaiting next week's US inflation

Gold remained at familiar levels on Wednesday, trading near $2,312 amid rising US Treasury yields and a strong US dollar. Traders await unemployment claims on Thursday, followed by Friday's University of Michigan Consumer Sentiment survey.
President Biden threatens crypto with possible veto of Bitcoin custody among trusted custodians

Joe Biden could veto legislation that would allow regulated financial institutions to custody Bitcoin and crypto. Biden administration’s stance would disrupt US SEC’s work to protect crypto market investors and efforts to safeguard broader financial system.
Navigating the future of precious metals

In a recent episode of the Vancouver Resource Investment Conference podcast, hosted by Jesse Day, guests Stefan Gleason and JP Cortez shared their expert analysis on the dynamics of the gold and silver markets and discussed legislative efforts to promote these metals as sound money in the United States.
