How much lost ground can the S&P 500 bulls recover?

Stocks couldn’t build on Wednesday’s gains, and the bulls had to face selling pressure during yesterday’s regular session. While they’ve dealt with a good part of the intraday downswing, they couldn’t close the opening bearish gap. How does the bullish case look at the moment?
S&P 500 in the Short-Run
We’ll open this section by quoting from today’s intraday Stock Trading Alert that we’ve posted prior to this regular article (charts courtesy of http://stockcharts.com ):
(…) S&P 500 opened lower yesterday, and despite the selling pressure during the session, prices held up relatively well. Having closed at 2912, the breakout above 61.8% Fibonacci retracement has been however rejected.
Given the positive market reaction to Big Tech earnings earlier this week, it was reasonable to expect a similar reaction to the Amazon (AMZN) report after the markets closed yesterday. The company’s revenue managed to beat expectations, having risen 26%, yet the Q1 profit fell to $2.5bn from $3.6bn in the prior year. The market deemed it underwhelming, and the stock soundly declined in aftermarket trading, dragging the index lower along.
Prices declined steeply in the overnight trading, extending yesterday’s moderate downswing. That’s how yesterday’s session looks on the daily chart:
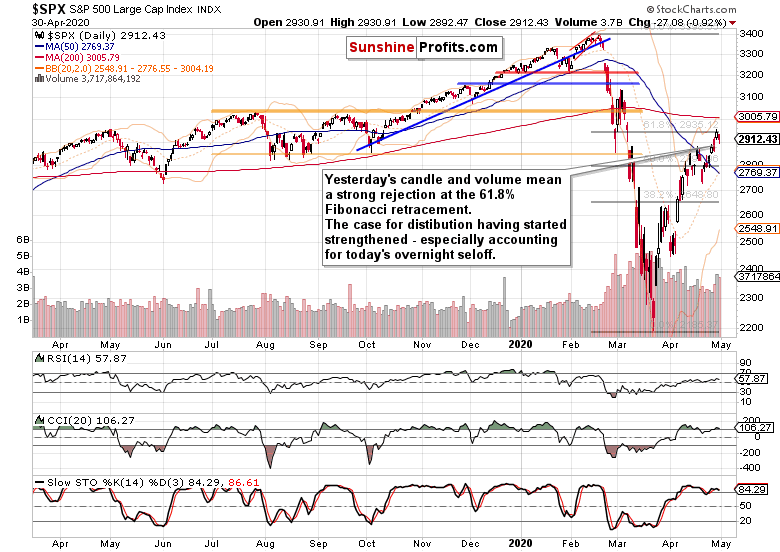
The daily candle and volume examination leans in favor of an early stage of a downswing. The chart itself though doesn’t preclude a consolidation phase coupled with a renewed run to the 61.8% Fibonacci retracement. Given the sizable volume of last two sessions though, such a run would have little change of overcoming this resistance, which is also reinforced by the zone defining the early March bearish gap.
The fly in the ointment is the reaction to Amazon earnings. This steep a selloff makes it more than likely that the bear leg has already started in earnest, without a renewed attempt to reach the 61.8% Fibonacci retracement.
All right, as the S&P 500 futures trade now at around 2835, does that mean we won’t get a better price point to exit our long position? Regardless of the deterioration we have seen in many S&P 500 sectors yesterday, we’re likely to be offered an opportunity to reassess the outlook and our decision (coupled with a better price point than the current one).
As a result, we’re of the opinion that exiting the open long position at this moment (4:10 AM EST) isn’t justified.
Indeed, prices have moved to 2850 just before 5:00 AM EST. But the point is not about selling having momentarily waned. It’s about both the credit markets and S&P 500 sectoral strength. Let’s start with the debt markets.
The Credit Markets’ Point of View
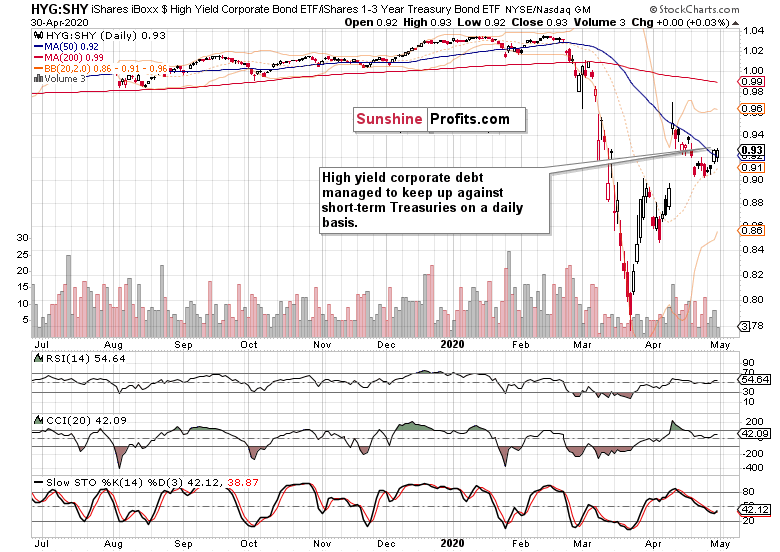
The high yield corporate debt to short-term Treasuries ratio (HYG:SHY) held up well on a daily basis. The volume examination of the HYG ETF itself (and also of municipals, the HYD ETF) is encouraging – the short-term debt markets aren’t showing signs of deterioration.
However, this can’t be said about investment grade corporate bonds to the longer-dated Treasuries ratio (LQD:IEI).

It’s not a good short-term omen that the decline in the ratio was driven primarily by the declining high quality corporate debt. Unless this gets reversed and we see a breakout higher out of the bullish flag, this doesn’t bode for the risk-on environment.
Key S&P 500 Sectors in Focus
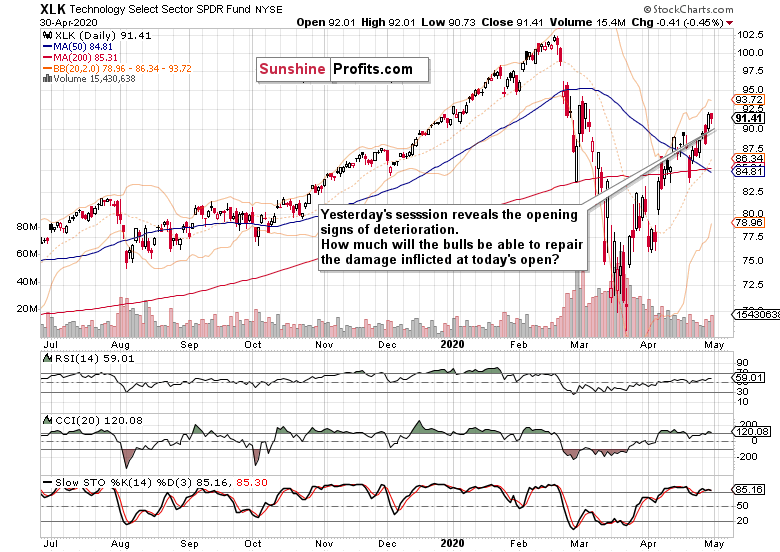
The daily candle in the tech sector doesn’t lean in the direction of immediate gains. We’ve already mentioned the Amazon (AMZN) situation. Soon after the open, we’ll see the extent of damage suffered throughout the sector, and assess the ability of the bulls to recover.
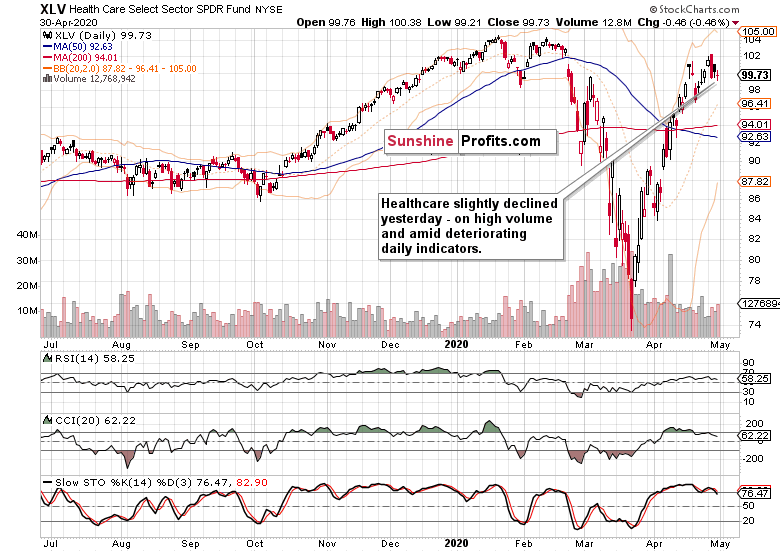
While healthcare didn’t decline much, it’s in a precarious technical situation. The deteriorating daily indicators point to short-term downside, and higher volume of yesterday’s session points to increasing involvement of the sellers. Just as in tech, the buyers‘ ability to come back will guide our upcoming trading decision.
As the credit markets didn’t give all too clear signals yesterday, which way did the financials move?
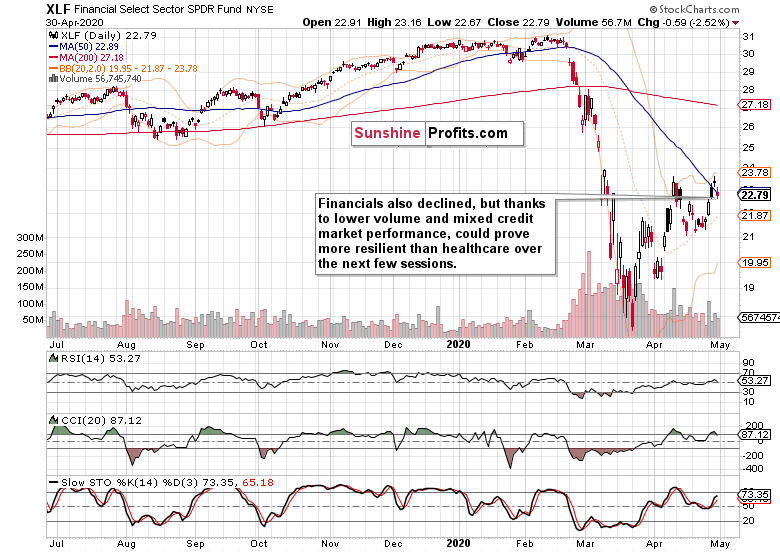
They moved down, but could prove more resilient than healthcare in the upcoming test of the bulls.
As for energy (XLE ETF), materials (XLB ETF) and industrials (XLI ETF), it’s these sectors that have us on the edge. They all declined. While it can turn out to be the opening salvo in their own downside reversals, their individual charts point rather in the direction of only a short-term setback. This is because their prior upswings have made it above their preceding local highs, and also the volume increase on their yesterday’s downswing didn’t rise as much as it did in either in tech or healthcare.
From the Readers’ Mailbag
Q: I’m very much a bear with where this market is right now, however I finally went long based on your analysis, and I caught the last big leg up. So thank you! However, today (today’s premarket session) has been brutal…
A: Yes, the disconnect between the real economy incoming data and the stock market strength is palpable. However, we trade the stock market, and have to be keenly aware of what’s going on there.
That’s right, the Amazon disappointment is a setback, and we’ll be monitoring the buyers as they go about repairing the damage. So far, it’s nothing to call home about, but let’s not jump to conclusions just yet, we mean right now.
That however can’t be said about the moment that is much nearer to when you reading this article (10:35 AM EST). The weak reaction to a positive surprise in the ISM Manufacturing PMI number didn't really lift stocks. While the market can move in tricky ways in the very short-term, we see sideways to bearish bias as the ruling one right now. As it’s reflected in both the credit markets and selected key S&P 500 sectors right now, we have just taken a new trading decision. How will it pay off?
Summary
Summing up, the 61.8% Fibonacci retracement challenge fizzled out yesterday, and given the Amazon aftermarket developments, the S&P 500 is bound to open lower later today. The credit markets’ message is rather inconclusive in the very short-term, but the cracks in the sectoral performance are more apparent. Monitoring the extent of the bulls’ comeback has formed the basis for our upcoming trading decisions. Earlier today, the open long position remained justified as we were likely to be offered a better exit point down the road. And we indeed were. Then, a new trading decision followed…
Want free follow-ups to the above article and details not available to 99%+ investors? Sign up to our free newsletter today!
Want free follow-ups to the above article and details not available to 99%+ investors? Sign up to our free newsletter today!
Author

Monica Kingsley
Monicakingsley
Monica Kingsley is a trader and financial analyst serving countless investors and traders since Feb 2020.


