Gold Weekly Forecast: Focus will be on the real economy
- Gold retreated for the third week in a row, hitting two-month low near $2,540.
- The loss of the $2,500 mark could spark a deeper retracement.
- A cautious Fed and the Trump-led rally in the US Dollar weighed on the metal.

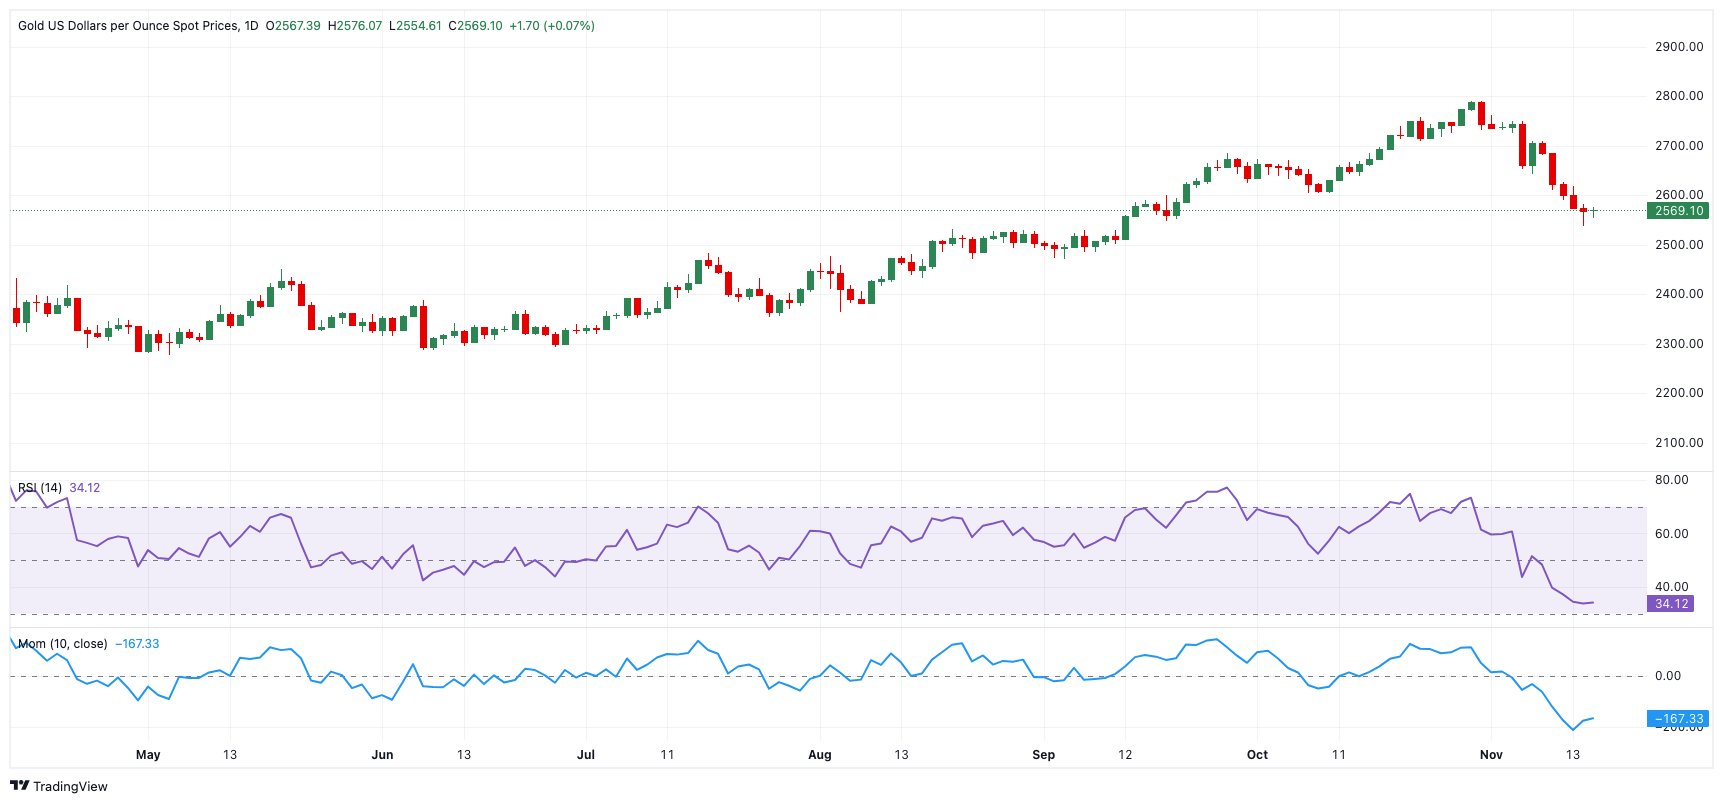
The corrective move in Gold (XAU/USD) remained well in place for yet another week, this time revisiting the $2,540 region per troy ounce, or a fresh two-month low, where some initial contention zone appears to have emerged.
In fact, the pronounced move higher in the precious metal that kicked in with the new year seems to have met some decent resistance in the boundaries of the $2,800 mark so far. Furthermore, having gained around 30% from January to those peaks in late October, the yellow metal shed around 9% just in a couple of trading weeks in November.
An exclusive culprit: The “Trump-trade”
The metal fared pretty well during October, a month in which the US Dollar (USD) closed with gains in every single week on the back of expectations of a potential win by the Republican candidate Donald Trump.
Gold prices did even better and managed to extend the march north during last month despite quite a marked recovery in US yields across different maturity periods.
However, all turned upside-down for Bullion since the moment votes secured Trump a second term, this time as 47th US President.
In fact, the US dollar has regained a strong upside impulse since Trump’s victory, keeping the commodity complex as well as the risk-linked galaxy well under pressure. While the US Dollar Index (DXY), which tracks the Greenback versus a basket of direct rival currencies, advanced to fresh 2024 tops north of the 107.00 barrier, the precious metal embarked on a robust retracement to the vicinity of the key $2,500 mark, from where it has now attempted to rebound.
The main concerns hovering around the non-yielding metal include the likely implementation of tariffs on European and Chinese imports by the Trump administration in combination with looser corporate regulation and fiscal policy.
The takeaway is that these measures could permeate through the economy via inflationary pressure and, more likely than not, end up motivating the Federal Reserve (Fed) to alter its ongoing easing cycle. The potential degree of the acceleration of the consumer prices could even reignite the resumption of some tightening measures by the central bank.
Gold prices should remain supported by geopolitics
A key factor behind the surge in Gold prices has been ongoing geopolitical tensions, particularly the escalating conflict between Israel and Hamas, alongside the protracted war in Ukraine.
Every time there’s fresh news of worsening conditions in these conflicts, investors rush to safe-haven assets like Gold. Unfortunately, there’s no sign of these crises being resolved anytime soon, which should put a floor on further bouts of selling pressure hurting the precious metal.
Once again, President-elect Trump will have his say on the Russia-Ukraine crisis, as he pledged to “end” that war quickly.
To sum up, the prospects of the resurgence of inflation in the US economy and its direct impact on the Fed’s mind should keep Gold prices under the microscope but not rule out deeper pullbacks going forward. Once, and if, the looser fiscal policy and tariffs commence, it will come time to evaluate the extension and duration of those policies, allowing the yellow metal to start recouping part of the shine lost.
Gold daily chart
Gold technical outlook
Gold is on track to potentially revisit its recent low of $2,536 from mid-November. If prices dip further, the next targets could be the September low of $2,471 ahead of the key 200-day Simple Moving Average (SMA) at $2,397. If this zone fails to hold, additional downside could aim for $2,353 (July low), seconded by the June low of $2,286 and May’s low of $2,277. Breaking through these levels might pave the way for a deeper move toward the March low of $2,146 and possibly the 2024 bottom at $1,984 seen on February 14.
On the upside, resistance could come in at the 55-day SMA around $2,638. If Gold manages to rally beyond this, it might aim for the recent all-time high of $2,790 set at the end of October, with Fibonacci extensions of the 2024 climb at $3,009, $3,123 and $3,288.
Fed FAQs
Monetary policy in the US is shaped by the Federal Reserve (Fed). The Fed has two mandates: to achieve price stability and foster full employment. Its primary tool to achieve these goals is by adjusting interest rates. When prices are rising too quickly and inflation is above the Fed’s 2% target, it raises interest rates, increasing borrowing costs throughout the economy. This results in a stronger US Dollar (USD) as it makes the US a more attractive place for international investors to park their money. When inflation falls below 2% or the Unemployment Rate is too high, the Fed may lower interest rates to encourage borrowing, which weighs on the Greenback.
The Federal Reserve (Fed) holds eight policy meetings a year, where the Federal Open Market Committee (FOMC) assesses economic conditions and makes monetary policy decisions. The FOMC is attended by twelve Fed officials – the seven members of the Board of Governors, the president of the Federal Reserve Bank of New York, and four of the remaining eleven regional Reserve Bank presidents, who serve one-year terms on a rotating basis.
In extreme situations, the Federal Reserve may resort to a policy named Quantitative Easing (QE). QE is the process by which the Fed substantially increases the flow of credit in a stuck financial system. It is a non-standard policy measure used during crises or when inflation is extremely low. It was the Fed’s weapon of choice during the Great Financial Crisis in 2008. It involves the Fed printing more Dollars and using them to buy high grade bonds from financial institutions. QE usually weakens the US Dollar.
Quantitative tightening (QT) is the reverse process of QE, whereby the Federal Reserve stops buying bonds from financial institutions and does not reinvest the principal from the bonds it holds maturing, to purchase new bonds. It is usually positive for the value of the US Dollar.
Author

Pablo Piovano
FXStreet
Born and bred in Argentina, Pablo has been carrying on with his passion for FX markets and trading since his first college years.
















