|

Gold to Silver ratio has resumed lower

Gold-to-Silver ratio had an overshoot to the upside during the Covid-19. It ended the all-time high on March 2020 at 126.4. The peak time is similar to the major low in World Indices. The ratio then quickly corrected lower in just 1 year to 62.51 and bottomed on February 2021. It has since traded in sideways for the last 3 years. However, the ratio has now started to turn lower and resumed the downside. Let’s see the latest daily outlook of AUG below.

Gold to Silver ratio daily chart

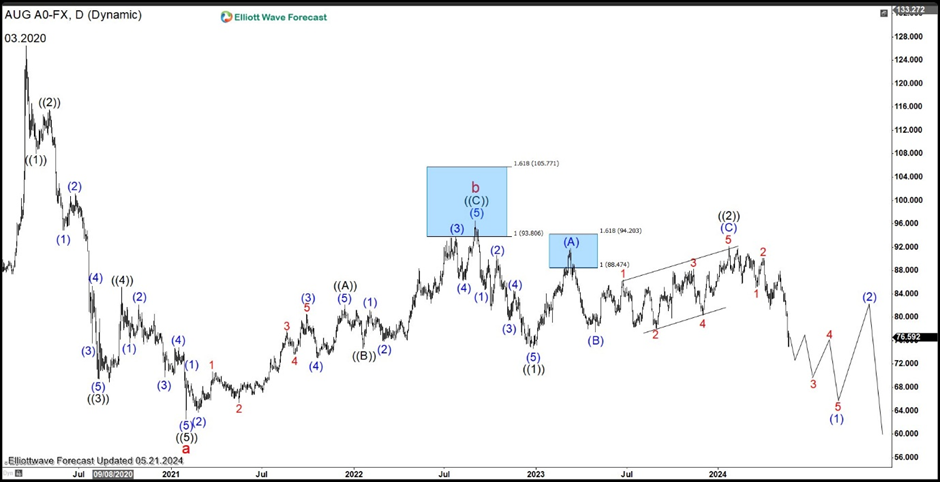
Gold-to-Silver ratio (AUG) daily chart above shows the selloff from March 2020 peak unfolded in 5 waves impulse. It ended in wave a at 62.51. The ratio then corrected in 3 waves as a zigzag Elliott Wave structure. Up from wave a, wave ((A)) ended at 82.13. Wave ((B)) dips ended at 74.65. The Last leg wave ((C)) ended at 96.49 which completed wave b. Note that the rally finished at the 100% – 161.8% fibonacci extension of wave ((A)). This supports the idea that the right side is bearish.

The ratio has turned lower in wave c. Down from wave b, wave ((1)) ended at 74.63. Wave ((2)) rally ended at 92.1 as a zigzag. The ratio has now turned lower in wave ((3)). Down from wave ((2)), wave 1 ended at 85.06 and rally in wave 2 rally ended at 90.13. It has then resumed lower again. Expect the ratio to extend lower in months to come, supporting both Gold and Silver. It also suggests Silver will from now on outperform Gold

Author

Elliott Wave Forecast Team

Elliott Wave Forecast Team

ElliottWave-Forecast.com

More from Elliott Wave Forecast Team
Share:

Editor's Picks

AUD/USD falls to near 0.7100 after slipping below 50-day EMA

AUD/USD depreciates after registering minor gains in the previous day, trading around 0.7120 during the Asian hours. The technical analysis of the daily chart shows the pair consolidating sideways within a rectangle pattern, as neither bulls nor bears gain control. The AUD/USD pair is holding a slight bearish tone however as it sits beneath both the nine-day and 50-day EMAs.

160.00: USD/JPY back near intervention territory after upbeat US jobs report

US Nonfarm Payrolls beat expectations by a wide margin in May, with 172K jobs added. The US Dollar rebounds after the release, helping USD/JPY recover from its intraday lows. Warnings from Japanese authorities continue to limit upside potential near the 160.00 threshold.

Gold targets $4,300 amid stronger Dollar

Gold faces increasing selling interest and navigates the area of three-month lows near the $4,300 mark per troy ounce on Friday. The precious metal’s decline comes as traders assess the stronger-than-expected NFP, while the bid bias in the Greenback and higher US Treasury yields also collaborate with the retracement.

Cardano hits five-year low even as Hoskinson clarifies "break" isn't an exit

Cardano (ADA) price is down 10% at press time on Friday, extending losses over 30% so far this week amid Charles Hoskinson's clarification that "break" isn't an exit.

Week ahead – Fed countdown begins amid US inflation data and geopolitical risks

Fed Chair Warsh’s first meeting approaches as key US inflation data could reshape expectations. Oil prices remain elevated as US-Iran talks continue; tariffs also return to the spotlight. ECB is expected to hike; will it be a one-off move or is July live?

The US economy defies the rules: 100 days into the Oil shock and the recession signal is still missing

More than three months after the start of the Iran war and the resulting disruption to global energy markets, the US economy continues to display remarkable resilience. The conflict has triggered a sharp rise in Oil prices, reignited inflationary pressures and fueled widespread concerns about a potential economic slowdown.