Gold Price Forecast: XAU/USD under pressure below $2,630

XAU/USD Current price: $2,627.47
- Financial markets turned risk-averse amid comments from US President-elect Donald Trump.
- The United States will publish multiple first-tier figures on Wednesday ahead of the Thanksgiving holiday.
- XAU/USD consolidates below $2,630, and technical readings favor another leg south.
Spot Gold trades uneventfully on Tuesday, confined to a tight range just below $2,630 a troy ounce. The market sentiment soured at the beginning of the day following comments from United States (US) President-elect Donald Trump. Trump threatened to impose tariffs of up to 25% on all products entering from Canada and Mexico and an additional 10% tariff on goods from China in posts on his Truth Social site.
Demand for safe-haven assets remained subdued throughout the first half of the day despite the dismal mood, keeping XAU/USD ranging. Wall Street’s opening, however, brought a fresh bout of US Dollar buying.
US data was mixed. On the one hand, the CB Consumer Confidence Index rose in November to 111.7, slightly below the 111.8 expected, while improving from 109.6 in October. The Present Situation Index increased to 140.9, while the Expectations Index ticked up to 92.3, well above the threshold of 80 that usually signals a recession ahead. New Home Sales, however, fell 17.3% in October, while the November Richmond Fed Manufacturing Index printed at -14, matching the previous reading and worse than the -10 anticipated by market players.
Wednesday will be a pretty busy day, as US markets will be closed on Thursday amid the Thanksgiving Holiday. The country will publish the Personal Consumption Expenditures (PCE) Price Index, the Federal Reserve (Fed) favorite inflation gauge, a revision of the Q3 Gross Domestic Product (GDP) and weekly employment figures, among other minor reports.
XAU/USD short-term technical outlook
The daily chart for the XAU/USD pair shows it hovers around its daily opening, with the risk still skewed to the downside. The pair posted a lower high and a lower low, while a bearish 20 Simple Moving Average (SMA) keeps heading south, providing dynamic resistance at around $2,662.00. Technical indicators, in the meantime, post uneven advances within negative levels, suggesting limited buying interest. Finally, a bullish 100 SMA keeps providing support at around $2,565.70.
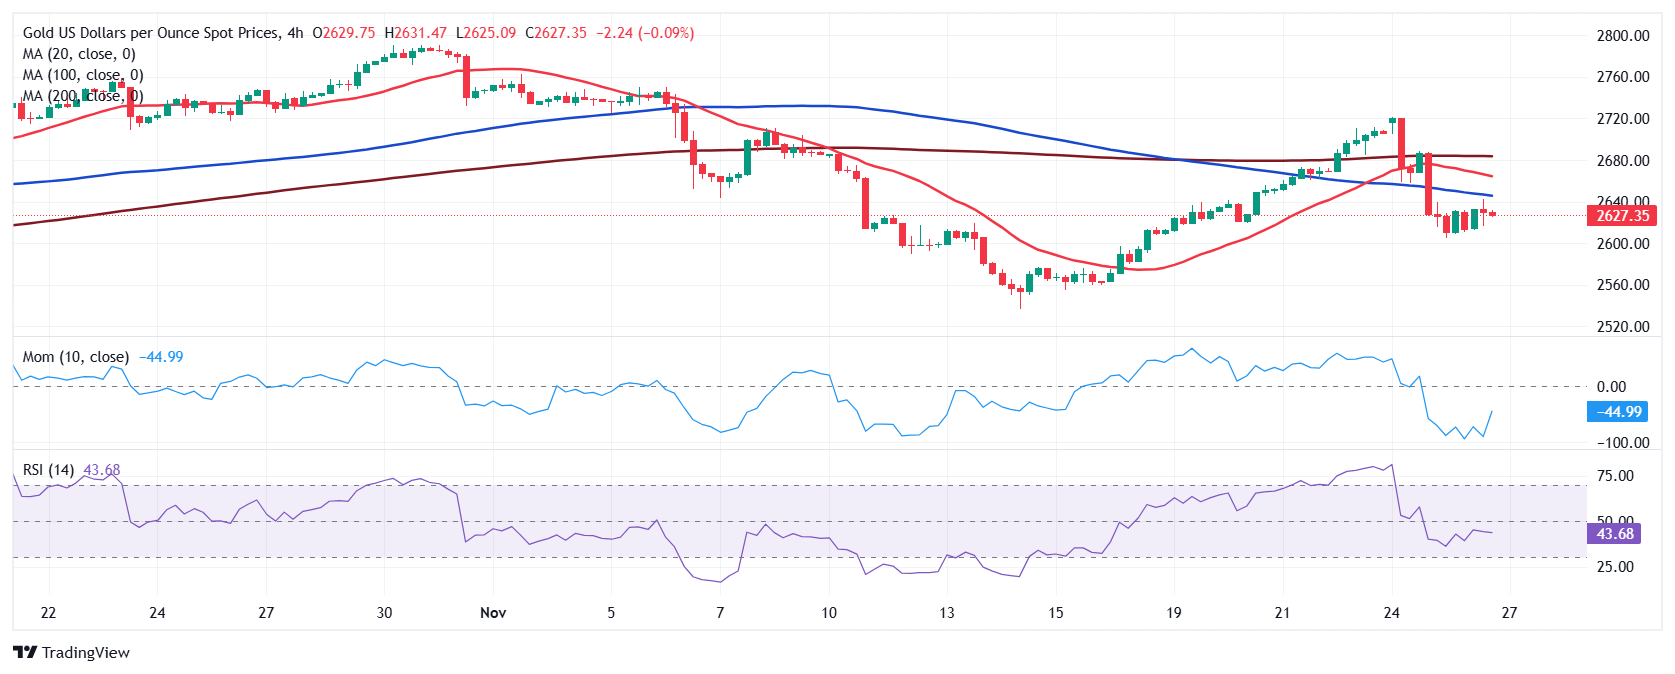
In the near term, and according to the 4-hour chart, XAU/USD is bearish. The pair develops below all its moving averages, with the 20 and 100 SMAs gaining downward traction. Finally, technical indicators resumed their slides within negative levels, in line with another leg south.
Support levels: 2,611.35 2,598.70 2,587.20
Resistance levels: 2,640.40 2,655.00 2,671.55
Author

Valeria Bednarik
FXStreet
Valeria Bednarik was born and lives in Buenos Aires, Argentina. Her passion for math and numbers pushed her into studying economics in her younger years.


