Gold Price Forecast: XAU/USD trades around $2,730

XAU/USD Current price: $2,734.50
- The looming United States presidential election fuels caution among market players.
- Central banks’ monetary policy announcements take centre stage this week.
- XAU/USD trades with modest losses, but the long-term view favours the upside.
A better market mood left XAU/USD trading lifeless on Monday. Gold hovers around Friday’s close at $2,736 a troy ounce, as investors preferred high-yielding assets. Bets on who will become the 47th United States (US) president set the market’s tone. Market participants evaluate whether the Federal Reserve (Fed) would be able to keep loosening the monetary policy or if the central bank will have to battle again increasing price pressures. Americans will go to the polls on Tuesday, with some initial results expected for early Wednesday.
Stock markets trade mixed, with the Nikkei 225 posting sharp losses but the rest of the Asian indexes closing in the green. In Wall Street, however, the three major indexes accelerated south after a mixed opening, as concerns pushed investors back into safety.
This week, besides the US election, will feature central banks’ monetary policy announcements. The Reserve Bank of Australia (RBA) will unveil its decision on Tuesday, while the Bank of England (BoE) and the Federal Reserve (Fed) will do so on Thursday.
As the US session develops, the US Dollar gathers strength amid mounting risk-aversion, although XAU/USD holds in range.
XAU/USD short-term technical outlook
The daily chart for the XAU/USD pair shows easing bullish momentum, although the risk remains skewed to the upside. The pair keeps developing above bullish moving averages, with the 20 Simple Moving Average (SMA) providing dynamic support at around $2,705.00. The 100 and 200 SMAs accelerated north well below the shorter one, reflecting buyers’ strength. Finally, technical indicators turned marginally lower but remain well above their midlines, hinting at a limited bearish potential.
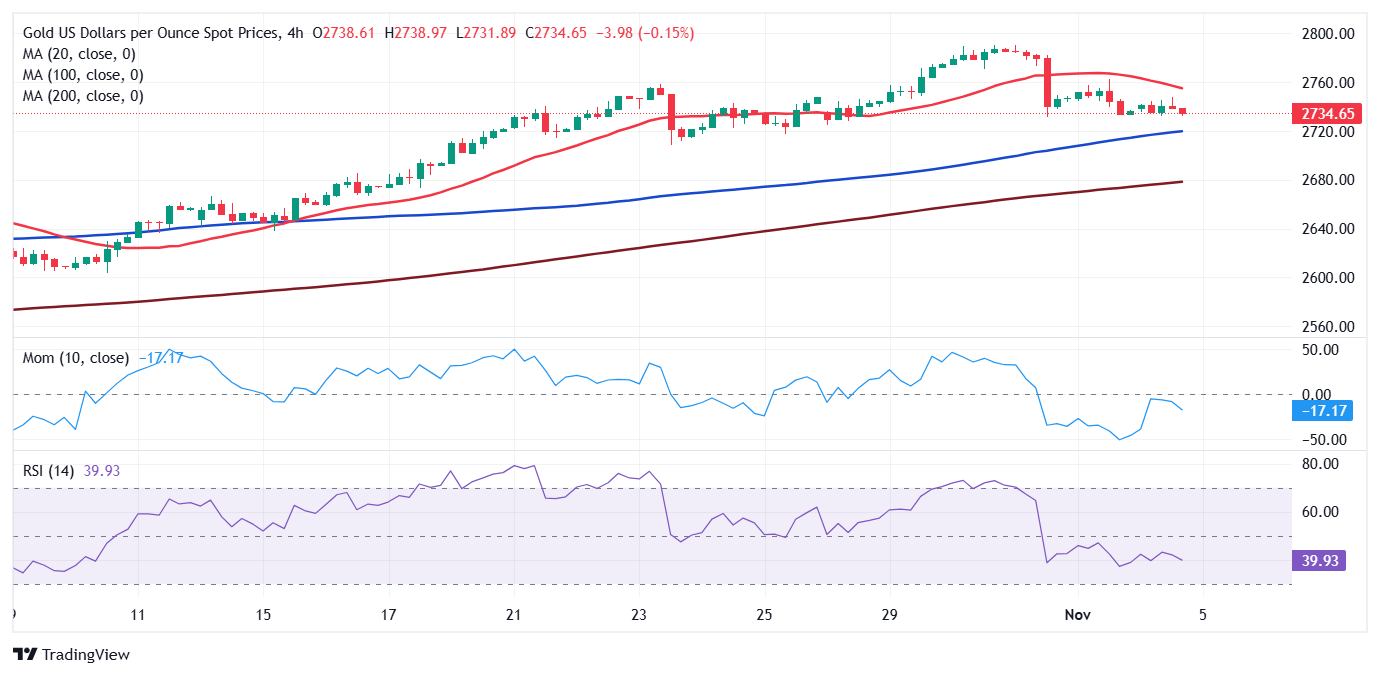
In the near term, and according to the 4-hour chart, on the contrary, sellers are in control. Technical indicators turned firmly lower within negative levels, while the 20 SMA accelerates south above the current level. The 100 and 200 SMAs maintain their upward slopes below the current price, yet another leg south seems likely should XAU/USD break below $2,730, the immediate support area.
Support levels: 2,730.00 2,718.35 2,705.00
Resistance levels: 2,747.75 2,760.40 2,772.50
Premium
You have reached your limit of 3 free articles for this month.
Start your subscription and get access to all our original articles.
Author

Valeria Bednarik
FXStreet
Valeria Bednarik was born and lives in Buenos Aires, Argentina. Her passion for math and numbers pushed her into studying economics in her younger years.


