Gold Price Forecast: XAU/USD takes out all key resistance levels; where next?
- Gold price consolidates a two-day upsurge above $2,650 early Friday.
- The US Dollar stalls its uptrend amid sluggish US Treasury bond yields and a cautious mood.
- Gold price cheers geopolitical woes and a bullish daily RSI as buyers scale all key technical hurdles.

Gold price is holding close to the two-week high of $2,664 early Friday as buyers take a breather after gaining about 1.5% so far this week.
Gold price eyes more upside amid geopolitical risks
Gold price benefitted alongside the US Dollar (USD) on the first trading day of the New Year as investors flocked to safe havens amid escalating geopolitical conflicts and increased tensions surrounding the upcoming policies from the US President-elect Donald Trump and the US Federal Reserve (Fed).
Expectations that Trump’s protectionist policies could spur fresh US-Sino trade tensions and the haven demand for Gold price. However, his policies are seen as inflationary and could prompt the Fed to maintain its cautious approach to future rate cuts. The Fed’s measured stance could check the upside in the non-interest-bearing bright metal.
Meanwhile, Gold traders created fresh buying positions after Reuters reported that Israeli airstrikes killed at least 68 Palestinians in Gaza, including the Hamas-controlled police chief, his deputy, and nine displaced people. “Additionally, Russia launched a drone strike on the Ukrainian capital Kyiv early on Wednesday, causing damage in at least two districts,” Reuters said.
Moreover, Axios reported that outgoing US President Biden was presented with options for a potential attack on Iran's nuclear facilities if Tehran moves towards a nuclear weapon before January 20.
Markets also digested the strong US jobs data, which showed that the Initial Jobless Claims hit an eight-month low last week, falling by 9,000 to 211,000 versus 222,000 estimated. However, the data appeared distorted due to the year-end holiday season.
The focus now shifts toward the top-tier US ISM Manufacturing PMI data and a speech by Richmond Fed President Tom Barkin due later on Friday for some fresh trading incentives for Gold price.
However, the broader market sentiment amid lingering Middle East geopolitical tensions and China’s economic worries will continue to play a pivotal role in the Gold price action.
Gold price technical analysis: Daily chart
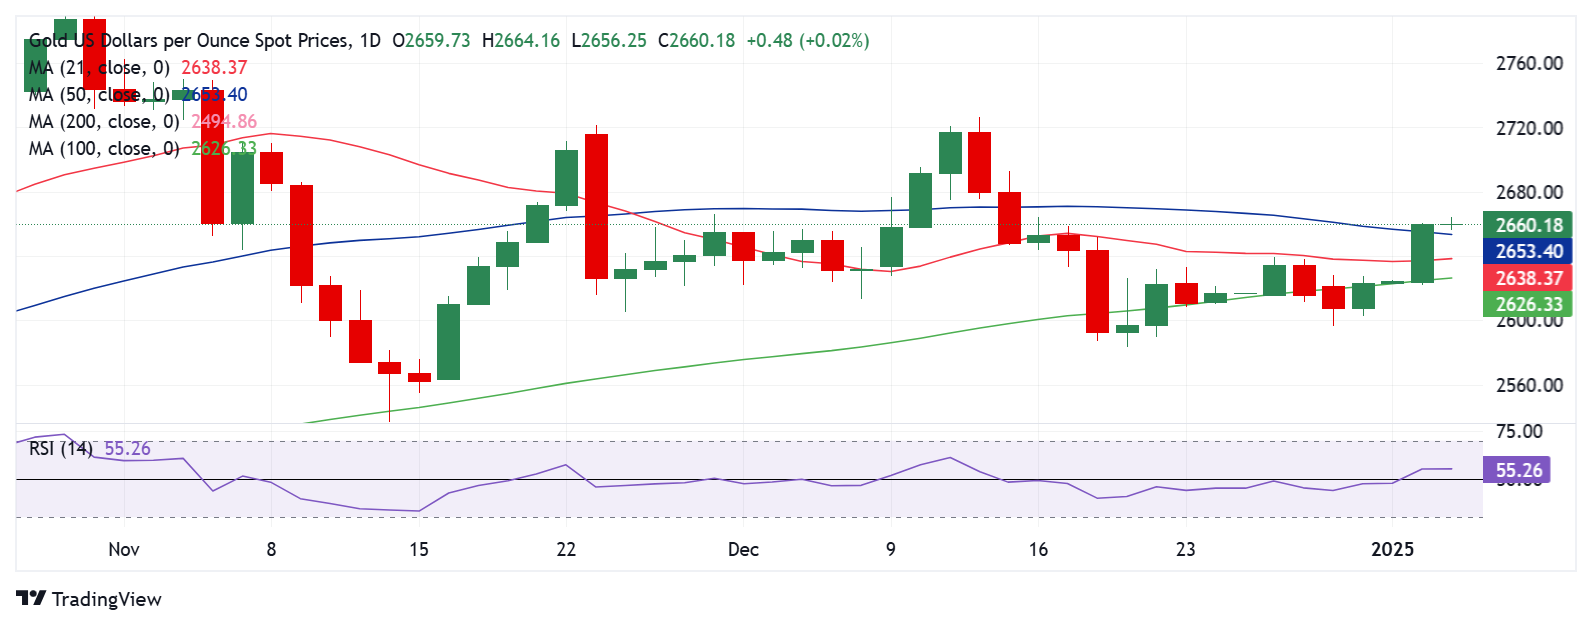
The daily chart shows that the 14-day Relative Strength Index (RSI) has recaptured the 50 level, opening up further upside for Gold price.
Thursday’s Gold price rally took out all key major daily Simple Moving Averages (SMA), with the price closing above the critical 50-day SMA, then at $2,655.
If buyers regain traction, the next relevant upside target aligns at the $2,700 round level, above which the December 12 high of $2,726 will be challenged.
On the flip side, the immediate support is at the previous resistance of 21-day SMA at $2,638 if the 50-day SMA, now at $2,653, gives way.
A daily candlestick close below the latter will negate the recovery momentum, fuelling a fresh downtrend toward the weekly low of $2,596.
Economic Indicator
ISM Manufacturing PMI
The Institute for Supply Management (ISM) Manufacturing Purchasing Managers Index (PMI), released on a monthly basis, is a leading indicator gauging business activity in the US manufacturing sector. The indicator is obtained from a survey of manufacturing supply executives based on information they have collected within their respective organizations. Survey responses reflect the change, if any, in the current month compared to the previous month. A reading above 50 indicates that the manufacturing economy is generally expanding, a bullish sign for the US Dollar (USD). A reading below 50 signals that factory activity is generally declining, which is seen as bearish for USD.
Read more.Next release: Fri Jan 03, 2025 15:00
Frequency: Monthly
Consensus: 48.4
Previous: 48.4
Source: Institute for Supply Management
The Institute for Supply Management’s (ISM) Manufacturing Purchasing Managers Index (PMI) provides a reliable outlook on the state of the US manufacturing sector. A reading above 50 suggests that the business activity expanded during the survey period and vice versa. PMIs are considered to be leading indicators and could signal a shift in the economic cycle. Stronger-than-expected prints usually have a positive impact on the USD. In addition to the headline PMI, the Employment Index and the Prices Paid Index numbers are watched closely as they shine a light on the labour market and inflation.
Author

Dhwani Mehta
FXStreet
Residing in Mumbai (India), Dhwani is a Senior Analyst and Manager of the Asian session at FXStreet. She has over 10 years of experience in analyzing and covering the global financial markets, with specialization in Forex and commodities markets.


