Gold Price Forecast: XAU/USD struggles to retain the $2,600 mark

XAU/USD Current price: $2,599.70
- Prevalent US Dollar demand pushed Gold to its lowest since mid-September.
- The United States will release the October Consumer Price Index on Wednesday.
- XAU/USD slides for a third consecutive day, sellers are not yet done.
Spot Gold consolidates around the $2,600 mark on Tuesday after extending its recent slide to $2,589.57 a troy ounce, its lowest since September. Demand for the US Dollar (USD) dominates financial boards in a so far, data-light week, with the focus still on United States (US) political developments and their possible effects on the global economy. Tariffs-related anxiety reached European shores amid a continued economic setback in the Old Continent, while a political crisis in Germany intensified concerns.
Meanwhile, the poor stocks’ performance further fuels US Dollar demand. Most Asian and European indexes closed in the red, while Wall Street pared its latest advance. The three major indexes post losses, albeit limited.
Investors will closely follow upcoming US data. The country will publish the October Consumer Price Index (CPI) on Wednesday, foreseen at 0.2% MoM and 2.6% YoY, the latter higher than the previous 2.4%. The annual core CPI, however, is expected to remain steady at 3.3%. Other than that, market participants will keep speculating about what Trump’s return to the White House will mean for the US and the rest of the world.
XAU/USD short-term technical outlook
From a technical point of view, XAU/USD is poised to extend its decline. In the daily chart, the pair has fallen even further below its 20 Simple Moving Average (SMA), which slowly gains downward traction. The 100 and 200 SMAs keep heading higher below the current level, with the shorter one providing dynamic support at around $2,537.80. Technical indicators, in the meantime, have decelerated their slides well into the negative territory, not enough yet to consider a potential reversal or an interim bottom.
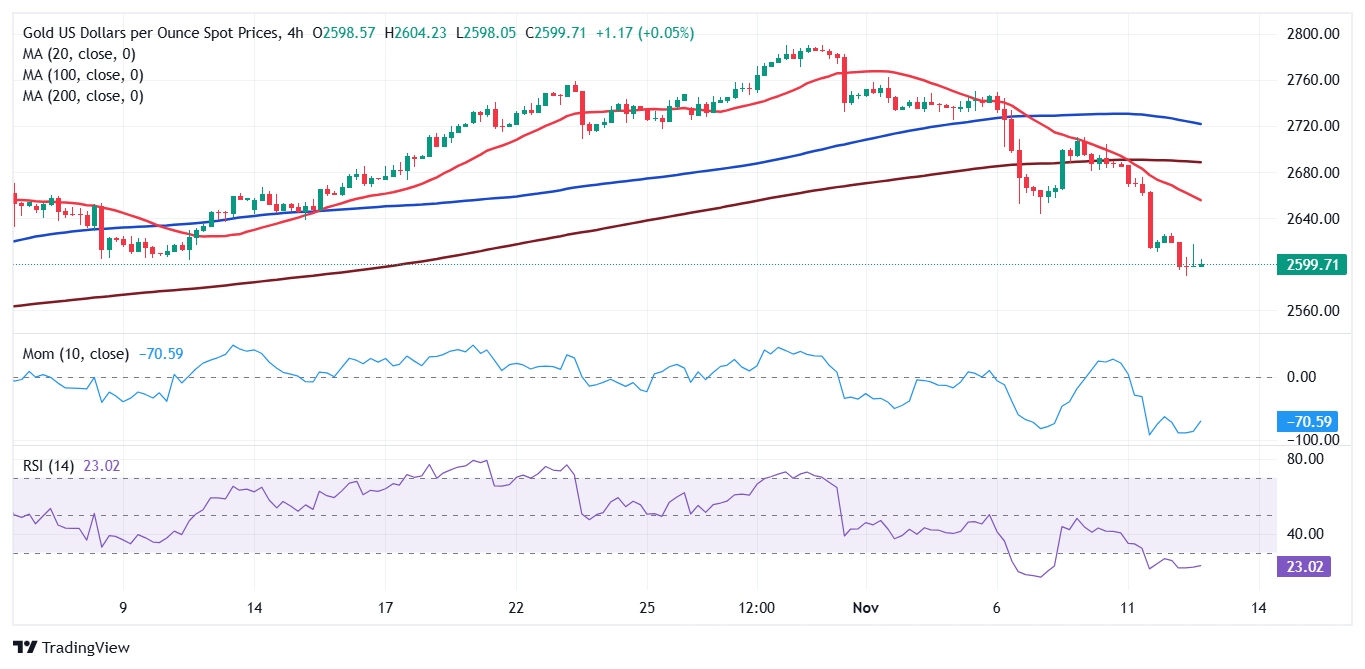
In the near term, and according to the 4-hour chart, the risk clearly skews to the downside. The 20 SMA head firmly south, well-below the longer ones, which also grind south. Finally, technical indicators resumed their slides after correcting extreme oversold conditions, still suggesting lower lows ahead.
Support levels: 2,588.70 2,572.45 2,560.65
Resistance levels: 2,612.60 2,627.10 2,639.05
Premium
You have reached your limit of 3 free articles for this month.
Start your subscription and get access to all our original articles.
Author

Valeria Bednarik
FXStreet
Valeria Bednarik was born and lives in Buenos Aires, Argentina. Her passion for math and numbers pushed her into studying economics in her younger years.


