Gold Price Forecast: XAU/USD retreats from record highs, retains the bullish stance

XAU/USD Current price: $2,456.23
- The US Dollar corrects higher after reaching extreme oversold conditions.
- Better-than-anticipated United States data helped the Greenback in the near term.
- XAU/USD corrects after reaching record highs, the overall bullish stance persists.
Spot Gold rallied to an all-time high of $2,483.60 on Wednesday as market players kept dampening the US Dollar on the back of mounting speculation the Federal Reserve (Fed) will cut interest rates in the September meeting. Extreme technical conditions helped the USD recover some ground after Wall Street’s opening, also backed by encouraging United States (US) macroeconomic data.
The country reported that Building Permits rose 3.4% in June, while Housing Starts in the same period were up 3%. Furthermore, Industrial Production increased 0.6% in June, beating expectations, while Capacity Utilization in the same month rose to 78.8% against the 78.6% anticipated.
Finally, it is worth adding that several Fed officials hit the wires, with their words tilting to the dovish side of the spectrum, seen by market players as an anticipation of the September cut. The central bank will meet by the end of July, and speculative interest hopes policymakers will offer some clearer clues about the near future of monetary policy. It is also worth remembering that Chairman Jerome Powell has repeated multiple times that decisions will be made meeting by meeting and depend entirely on macroeconomic developments.
On Thursday, the European Central Bank (ECB) will announce its decision on monetary policy. President Christine Lagarde and co. are widely anticipated to keep interest rates on hold this time after trimming them by 25 basis points (bps) in the previous meeting.
XAU/USD short-term technical outlook
The XAU/USD pair is trading in negative territory on a daily basis, hovering around $2,455. The slide, however, seems corrective given the overbought conditions technical indicators have reached in the daily chart. In the same time frame, the bright metal holds far above bullish moving averages, with the 20 Simple Moving Average (SMA) maintaining its upward slope at around $2,365 while above bullish 100 and 200 SMAs.
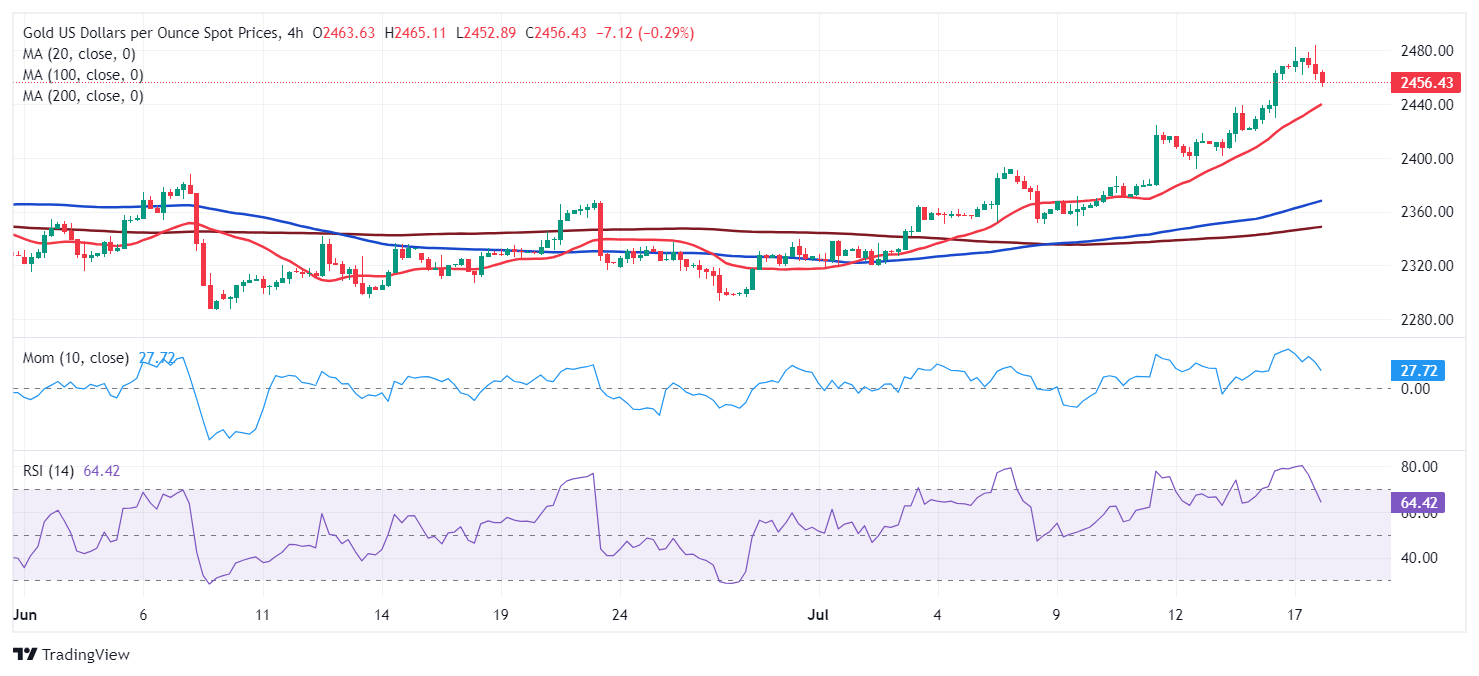
Technical readings in the 4-hour chart suggest that XAU/USD corrective slide may continue. The current candle is quite long, usually a sign of increased selling interest, while technical indicators retreat almost vertically from extreme overbought readings. Nevertheless, the pair keeps developing far above bullish moving averages, with the 20 SMA currently at around $2,435.50. Buyers could return around the latter if the level is reached, as the overall stance is still bullish.
Support levels: 2,448.90 2,435.50 2,422.65
Resistance levels: 2,465.00 2,483.70 2,495.00
Premium
You have reached your limit of 3 free articles for this month.
Start your subscription and get access to all our original articles.
Author

Valeria Bednarik
FXStreet
Valeria Bednarik was born and lives in Buenos Aires, Argentina. Her passion for math and numbers pushed her into studying economics in her younger years.


