Gold Price Forecast: XAU/USD retreated sharply, trades around $2,740

XAU/USD Current price: $2,739.91
- US Dollar demand resurged following another batch of encouraging American data.
- The US will release the October Nonfarm Payrolls report on Friday.
- XAU/USD shed roughly $50.00, and near-term readings suggest the slide could continue.
Spot Gold came under strong selling pressure after Wall Street’s opening, with XAU/USD retreating sharply from record highs and currently trading near a daily low of $2,731.45. A risk-averse mood took over financial markets on Wednesday when United States (US) data showed resilient economic growth and a healthy labour market, cooling interest rate cut expectations.
The Federal Reserve (Fed) will meet next week and announce its decision on monetary policy on Thursday, November 7. Odds for a 25 basis points (bps) interest rate cut are at 94.5%, slightly down from the 95.5% chance a week earlier. Still, market players ponder whether a Republican victory in the upcoming presidential election may force the Fed to slow the pace of loosening.
Meanwhile, the Bank of Japan (BoJ) decided to keep the interest rate target unchanged at 0.25% on Thursday and reiterated its forecast that inflation will persist near the 2% target. The announcement weighed on the Japanese Yen (JPY), providing support to the US Dollar.
Finally, the US reported that Initial Jobless Claims for the week ended October 25 improved to 216K from a revised 228K in the previous week. The country also released the September Personal Consumption Expenditures (PCE) Price Index, the Federal Reserve’s (Fed) favorite inflation gauge. PCE inflation was up 2.1% YoY and 0.2% MoM, as expected, while the core annual reading hit 2.7%, higher than the 2.6% anticipated by market participants.
Asian and European indexes edged sharply lower, leading to a second consecutive day of sharp losses in Wall Street.
The focus now shifts to the US Nonfarm Payrolls (NFP) report, which will be released on Friday. The economy is expected to have added 113K new job positions in October, while the unemployment rate is foreseen steady at 4.1%.
XAU/USD short-term technical outlook
The XAU/USD pair trimmed most of its weekly gains, and the daily chart shows the corrective decline may continue, albeit the pair is far from bearish. In the daily chart, technical indicators retreated sharply from overbought readings and head firmly south above their midlines. At the same time, the pair remains above all its moving averages, which maintain their bullish slopes. The 20 Simple Moving Average (SMA) currently develops at around $2,696.00, providing dynamic support.
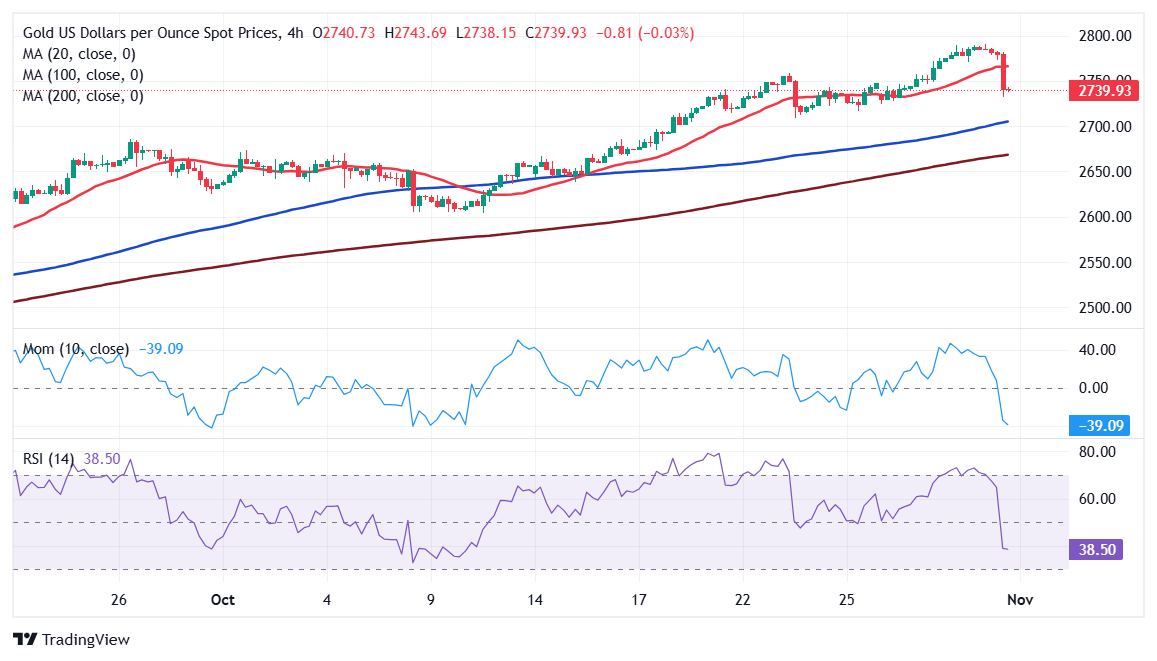
In the near term, and according to the 4-hour chart, the risk skews to the downside. XAU/USD broke below its 20 SMA, which lost its bullish strength at around $2,766.00. Nevertheless, the 100 and 200 SMAs keep heading firmly higher, well below the current level. Finally, technical indicators crossed their midlines into negative territory, maintaining their sharp downward slopes, in line with another leg lower.
Support levels: 2,731.45 2,716.90 2,701.70
Resistance levels: 2,747.75 2,760.40 2,772.50
Author

Valeria Bednarik
FXStreet
Valeria Bednarik was born and lives in Buenos Aires, Argentina. Her passion for math and numbers pushed her into studying economics in her younger years.


