Gold Price Forecast: XAU/USD resumes record rally, trades around $2,770.00

XAU/USD Current price: $2,770.49
- Upbeat US Consumer Confidence and tepid job creation boosted Gold’s demand.
- Focus on US data ahead of the Presidential election and the Federal Reserve decision.
- XAU/USD bullish case remains firm in place, buyers looking now to test $2,800.
Spot Gold surpassed the $2,770 mark on Wednesday as market participants keep seeking safety ahead of multiple first-tier data and looming US elections. The bright metal gained upward traction ahead of Wall Street’s opening, accelerating its advance following the release of United States (US) data.
The Conference Board Consumer Confidence Index increased in October to 108.7, up from 99.2 in September. The Present Situation Index rose to 138.0, while the Expectations Index soared to 89.1, well above the threshold of 80 that usually signals a recession ahead.
The encouraging figures were partially overshadowed by an employment-related report. The number of job openings on the last business day of September stood at 7.44 million, the US Bureau of Labor Statistics (BLS) reported in the Job Openings and Labor Turnover Survey (JOLTS). The cooling labor market is more good news than bad news, as the Federal Reserve (Fed) welcomes easing wage pressures.
Caution reigns as investors focus on the preliminary estimate of the Q3 Gross Domestic Product (GDP) and the Nonfarm Payrolls (NFP) report on Friday. In the middle, the US will also release the Personal Consumption Expenditure (PCE) Price Index, the Federal Reserve's (Fed) favorite inflation gauge. The combo could set the tone for the upcoming Fed monetary policy decision, scheduled to meet next week and announce its decision on Thursday, November 7. The decision will come 24 hours after the country heads into the polls to choose the next president.
XAU/USD short-term technical outlook
XAU/USD retreated from its fresh high but retains most of its intraday gains and trades at around $2,766. Technical readings in the daily chart favor another leg north. The 20 Simple Moving Average (SMA) accelerated higher, well below the current level, currently at around $2,685.00. The longer moving averages, in the meantime, also gained bullish traction, standing over $300 below the current level.
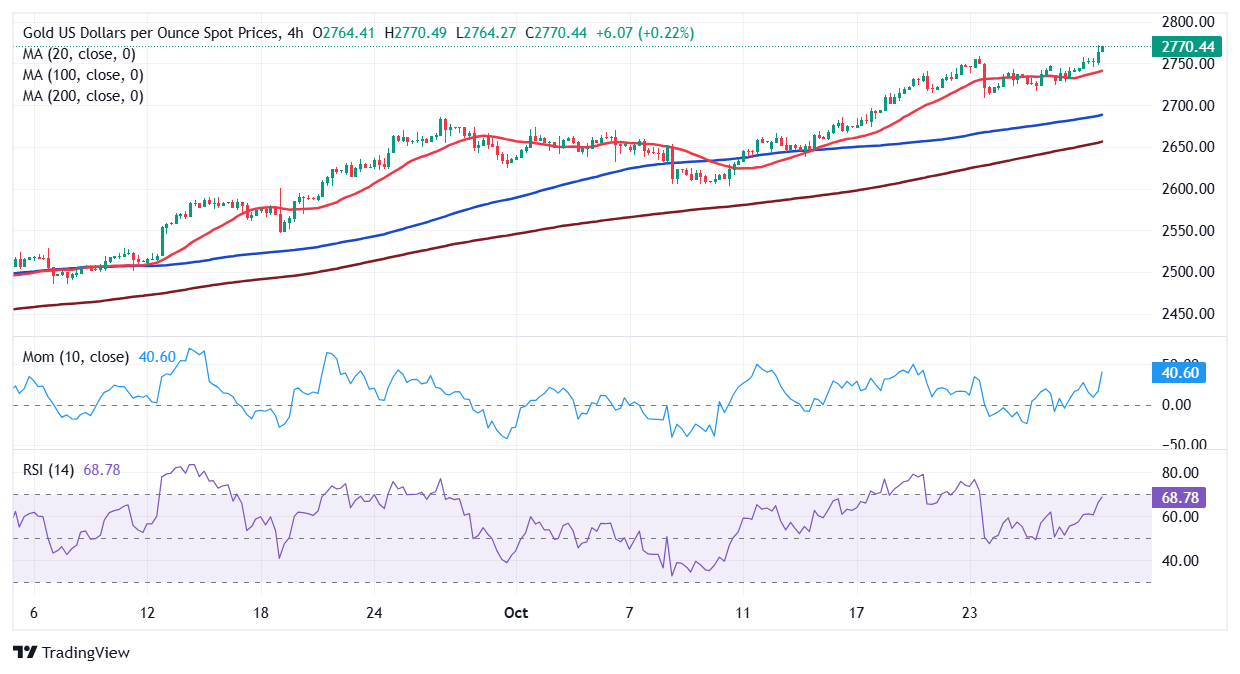
In the 4-hour chart, technical readings support a bullish continuation. Indicators head firmly north within positive territory, nearing overbought readings but still with room to run. Also, the 20 SMA turned higher below the current level, providing dynamic support at around $2,740.60. The 100 and 200 SMAs, in the meantime, maintain their firmly bullish slopes far below the shorter one.
Support levels: 2,751.90 2,739.70 2,721.20
Resistance levels: 2,775.00 2,790.00 2,810.00
Author

Valeria Bednarik
FXStreet
Valeria Bednarik was born and lives in Buenos Aires, Argentina. Her passion for math and numbers pushed her into studying economics in her younger years.


