Gold Price Forecast: XAU/USD reaches fresh monthly highs, aims for $2,400

XAU/USD Current price: $2,383.39
- As expected, the United States Consumer Price Index rose 3.4% YoY in April.
- Persistently above-target inflation likely to maintain the Fed in the wait-and-see path.
- XAU/USD is bullish in the near term, could soon test the $2,400 mark.
Gold price reached a fresh three-week high above $2,380.00 on Wednesday and maintains the bullish stance in the mid-American session. XAU/USD rallied following the release of the United States (US) Consumer Price Index (CPI) as inflation remained stubbornly high in April, according to the US Bureau of Labor Statistics (BLS). The CPI rose 3.4% YoY in April from 3.5% in March, meeting the market’s expectations, while the core annual reading printed at 3.6%, easing from the previous 3.8% but also in line with the market forecast. Finally, the monthly CPI rose 0.3%, slightly below the expected 0.4%.
Overall, the figures were not as terrible as feared, but enough to reaffirm the Federal Reserve's (Fed) hawkish stance. The central bank has maintained the status quo since hiking rates to a range of 5.25% - 5.50% in July 2023 for much longer than initially anticipated. In fact, the Fed’s Summary of Economic Projections (SEP) suggested policymakers were aiming for three potential rate hikes when they met in December. March is gone, and at the time being, investors hope US policymakers will deliver at least one rate cut in November.
What happened? Well, inflation remained above the central bank’s goal, while the labor market remained tight. Fed Chairman Jerome Powell lifted the tone and ended up delivering clearly hawkish messages. In such a scenario, speculative interest is eager to see softening inflation figures, precisely the opposite of what was seen throughout the first quarter of the year. As a result, investors drop the US Dollar.
XAU/USD short-term technical outlook
The daily chart for the XAU/USD pair shows bulls are in control, although a firmer rally remains unclear. Technical indicators advance within positive levels with uneven strength, yet at the same time, they stand at fresh multi-week highs, somehow supporting a bullish continuation. Furthermore, XAU/USD finally ran above a flat 20 Simple Moving Average, which provided near-term support at around $2,335 earlier in the week. Finally, the 100 and 200 SMAs accelerated their advances far below the current level, reflecting renewed buying interest.
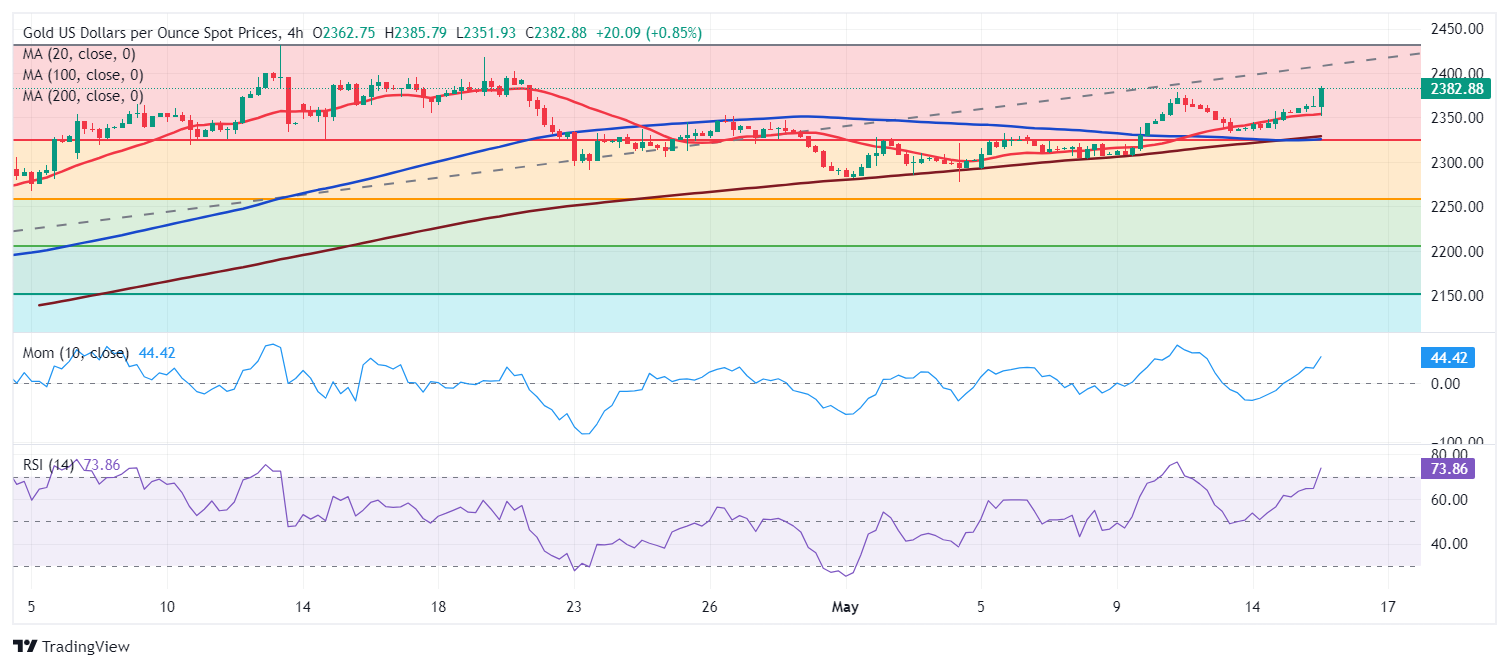
The near-term picture is bullish. Technical indicators in the 4-hour chart head firmly south, with the Relative Strength Index (RSI) indicator entering overbought territory without signs of giving up. Furthermore, the pair bounced sharply from a bullish 20 SMA, which gained upward traction above the also bullish 100 and 200 SMAs. XAU/USD could reach the $2,400 mark in the upcoming sessions despite widespread signs of risk appetite.
Support levels: 2,378.10 2,361.35 2,345.20
Resistance levels: 2,392.50, 2,403.10 2,417.60
Premium
You have reached your limit of 3 free articles for this month.
Start your subscription and get access to all our original articles.
Author

Valeria Bednarik
FXStreet
Valeria Bednarik was born and lives in Buenos Aires, Argentina. Her passion for math and numbers pushed her into studying economics in her younger years.


