XAU/USD Current price: $2,332.56
- The Bank of England kept rates unchanged, downwardly reviewed inflation forecasts.
- Federal Reserve’s speakers will gather all the attention on Friday.
- XAU/USD may extend gains in the near term, needs to run above $2,340.
Gold price posted an interesting comeback on Thursday, as buyers continued to defend the $2,300 area. XAU/USD fell throughout the first half of the day as the US Dollar benefited from a poor market mood. The Greenback changed course ahead of Wall Street’s opening following the release of the United States (US) Initial Jobless Claims for the week ended May 3. The report showed seasonally adjusted initial claims jumped to 231,000, the highest level since August 2023. The figure revived markets optimism as it is a tepid sign of a loosening labor market. As a result, stock markets surged while the US Dollar fell.
The Bank of England (BoE) announced its decision on monetary policy but had no impact beyond that on the British Pound. The BoE left interest rates unchanged at 5.25% for the sixth consecutive meeting and hinted at soon-to-come rate cuts, as inflation is forecast to fall below target. Policymakers upwardly revised growth figures while noting they would like to see more evidence price pressures are receding before loosening the monetary policy.
On Friday, the US will publish the preliminary estimate of the May Michigan Consumer Sentiment Index, while multiple Federal Reserve (Fed) speakers will hit the wires.
XAU/USD short-term technical outlook
The daily chart for XAU/USD shows it stalled its recovery around a mildly bullish 20 Simple Moving Average (SMA), which stands at around $2,335. The longer moving averages maintain their upward slopes far below the current level, while technical indicators remain below their midlines without apparent directional strength. Overall, Gold extends its consolidative phase ahead of a relevant directional catalyst.
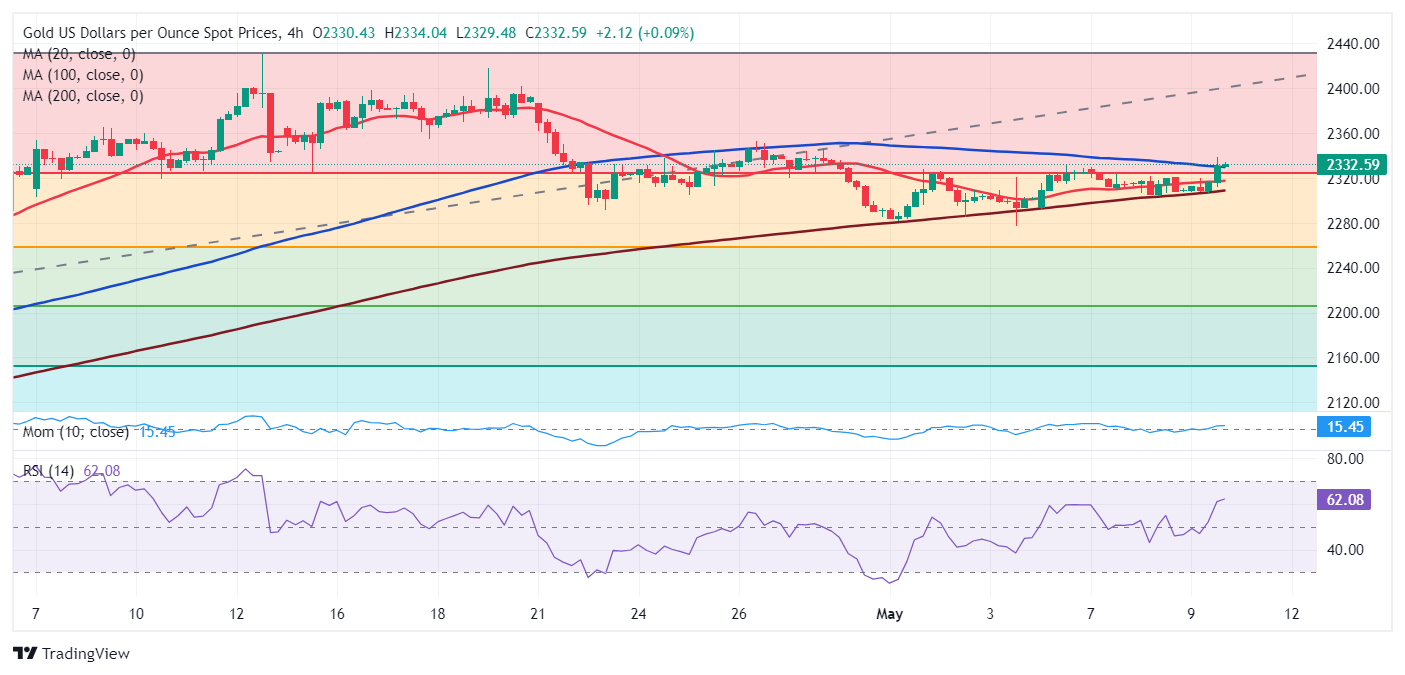
In the near term, and according to the 4-hour chart, XAU/USD is neutral. The pair met intraday buyers around a bullish 200 SMA but can’t extend gains beyond a mildly bearish 100 SMA. Finally, technical indicators stand flat within positive levels, suggesting bulls are more willing to jump in.
Support levels: 2,322.90 2,310.40 2,291.20
Resistance levels: 2,340.15 2,356.90 2,367.10
Information on these pages contains forward-looking statements that involve risks and uncertainties. Markets and instruments profiled on this page are for informational purposes only and should not in any way come across as a recommendation to buy or sell in these assets. You should do your own thorough research before making any investment decisions. FXStreet does not in any way guarantee that this information is free from mistakes, errors, or material misstatements. It also does not guarantee that this information is of a timely nature. Investing in Open Markets involves a great deal of risk, including the loss of all or a portion of your investment, as well as emotional distress. All risks, losses and costs associated with investing, including total loss of principal, are your responsibility. The views and opinions expressed in this article are those of the authors and do not necessarily reflect the official policy or position of FXStreet nor its advertisers. The author will not be held responsible for information that is found at the end of links posted on this page.
If not otherwise explicitly mentioned in the body of the article, at the time of writing, the author has no position in any stock mentioned in this article and no business relationship with any company mentioned. The author has not received compensation for writing this article, other than from FXStreet.
FXStreet and the author do not provide personalized recommendations. The author makes no representations as to the accuracy, completeness, or suitability of this information. FXStreet and the author will not be liable for any errors, omissions or any losses, injuries or damages arising from this information and its display or use. Errors and omissions excepted.
The author and FXStreet are not registered investment advisors and nothing in this article is intended to be investment advice.
Recommended Content
Editors’ Picks

EUR/USD hovers above 1.0300 ahead of EU Sentix data
EUR/USD is flat-lining above 1.0300 in the European session on Monday, undermined by a stronger US Dollar amid Trump's fresh tariff threats. Traders await the Eurozone Sentix data and Lagarde's speech for fresh trading incentives.

Gold breaks above $2,900 for the first time on record
Gold price continues to attract safe-haven flows amid persistent worries about Trump’s trade tariffs, refreshing record highs just above $2,900. Mounting trade war and inflationary concerns prompt investors to run for cover in the tradtional store of value, Gold.

GBP/USD looks vulnerable near 1.2400 on trade war fears
GBP/USD stays on the back foot near 1.2400 in the early European session on Monday. The pair appears vulnerable amid modest US Dollar strength-induced by US President Trump's latest tariff threats and mounting fears of a global trade war.

Dogecoin whale transactions fell by more than 70%; bearish move ahead
Dogecoin continues to trade down around $0.24 after falling more than 7% in the previous week. The technical outlook suggests a further correction as DOGE’s momentum indicators reflect bearish divergences. Santiment data show that DOGE whale transactions are falling, indicating signs of weakness.

Top Trumps: The global economy’s House of Cards
The year has barely started and we are learning the hard way what Donald Trump’s second term in office means for markets, analysts and global policymakers. It's like living through an episode of the political thriller, House of Cards.

The Best Brokers of the Year
SPONSORED Explore top-quality choices worldwide and locally. Compare key features like spreads, leverage, and platforms. Find the right broker for your needs, whether trading CFDs, Forex pairs like EUR/USD, or commodities like Gold.