Gold Price Forecast: XAU/USD now targets the all-time high near $2,800
- Gold prices added to Monday’s uptick and surpassed $2,740.
- The US Dollar could not sustain the initial bid bias on another tariff story.
- President Trump threatened to impose tariffs on Canada and Mexico.

Gold prices (XAU/USD) maintained their upward momentum unchanged on Tuesday, entering their four consecutive week with gains.
This time, the precious metal advanced north of the $2,740 mark per ounce troy backed by fresh threats by President Trump to impose 25% tariffs on Canadian and Mexican imports, starting as soon as February 1.
That said, the yellow metal extened its auspicious start to the week as US investors returned to their desks following the Martin Luther King Jr. holiday and Inauguration Day on Monday.
Contributing to the second consecutive daily advance, the US Dollar (USD) could not sustain the earlier bid bias, losing momentum afterwards and triggering the second consecutive daily pullback in the US Dollar Index (DXY), all after the initial impact of potential tariffs on Canada and Mexico in February ran out of steam.
Looking ahead, the spotlight is likely to stay on developments from the White House in a week with relatively few major economic data releases. Meanwhile, traders are also gearing up for the Federal Reserve’s January 28–29 meeting, where interest rates are expected to remain unchanged.
Gold remains firmly in focus as political events and central bank decisions loom, setting the stage for potential volatility in the days ahead.
Gold’s short-term technical outlook
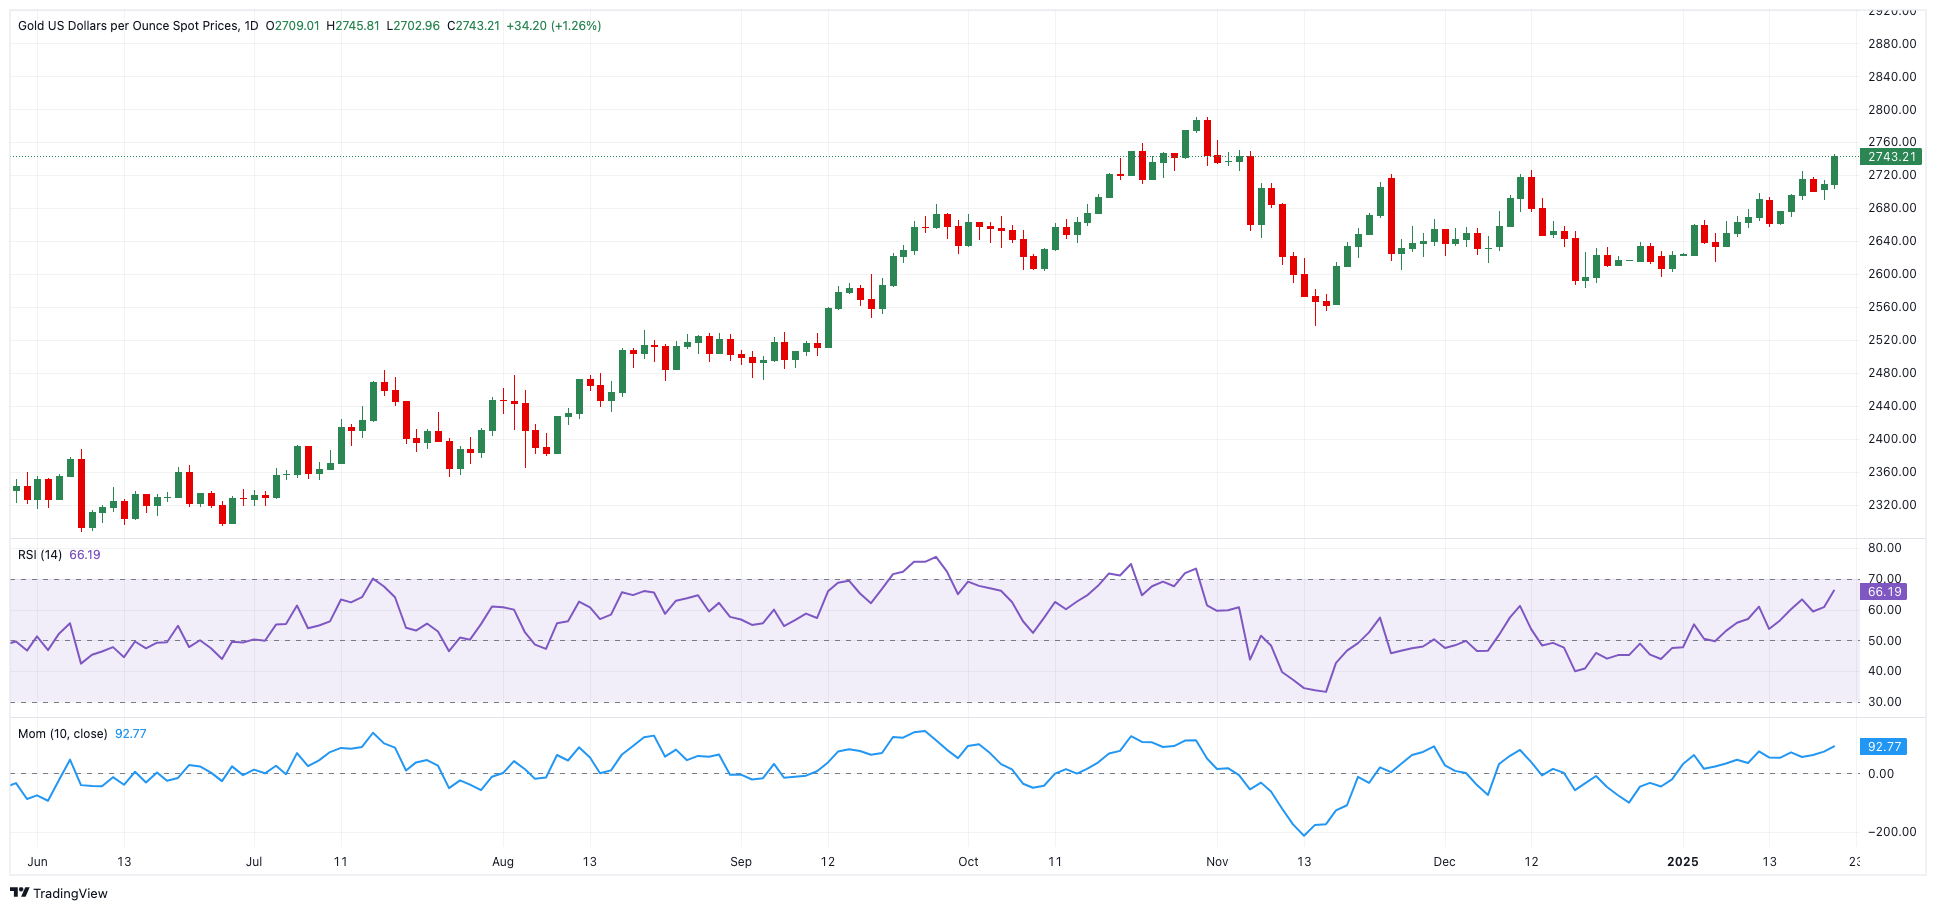
Gold’s next big target on the upside is $2,745, its 2025 high reached on January 21. Beyond that, traders will be eyeing the all-time high of $2,790, recorded on October 31. Should these levels be breached, Fibonacci projections point to potential milestones at $3,009, $3,123, and $3,288.
On the downside, the first line of defense lies at December’s low of $2,582, followed by November’s low of $2,536. Further support sits at the 200-day moving average of $2,513, with deeper corrections potentially targeting $2,471 (the September low) and $2,353 (the weekly low from July).
If the selloff intensifies, the next significant levels to watch are $2,286, the June low, and $2,277, the May low. The ultimate downside marker for now is $1,984, the 2024 low from February 14, which would represent a significant retracement from current levels.
Gold daily chart
Author

Pablo Piovano
FXStreet
Born and bred in Argentina, Pablo has been carrying on with his passion for FX markets and trading since his first college years.


