XAU/USD Current price: $2,307.17
- Financial markets maintained a cautious stance ahead of upcoming US events.
- Federal Reserve monetary policy announcement and US inflation coming up next.
- XAU/USD under selling pressure near $2,300, bearish breakout around the corner.
Spot Gold retreated from an intraday high of $2,319.79, with XAU/USD now trading below $2,310.00. Financial markets maintained the wait-and-see stance throughout Tuesday, as the macroeconomic calendar had nothing relevant to offer, and with first-tier events coming on Wednesday. Asian and European shares finished the day in the red and weighed on American indexes, which maintained the US Dollar on the winning side amid prevalent risk-aversion.
Investors await to hear from United States (US) policymakers, as the Federal Open Market Committee (FOMC) is undergoing a two-day meeting and will announce the outcome on Wednesday. The US central bank is widely anticipated to keep the Fed funds rate at the current rate of 5.25%-5.50%, and a rate cut is not seen until September at the earliest. Inflation has ticked marginally higher in the first quarter of the year, while the labor market remains tight, pushing the Federal Reserve (Fed) into maintaining a hawkish stance.
Ahead of the FOMC announcement, the country will release the May Consumer Price Index (CPI), foreseen up 0.1% MoM and 3.4% YoY, the latter matching the April reading. The figures tend to impact the FX board, despite the Fed's preference to look at the Personal Consumption Expenditures (PCE) Price Index when making monetary policy decisions.
XAU/USD short-term technical outlook
The daily chart for XAU/USD shows that bears retain control. The Momentum indicator bounced within negative levels, advancing but below its midline, while the Relative Strength Index (RSI) indicator aims to resume its slide at around 44. At the same time, the pair is trading below its 20 Simple Moving Average (SMA), while the longer moving averages maintain their upward slopes far below the current level.
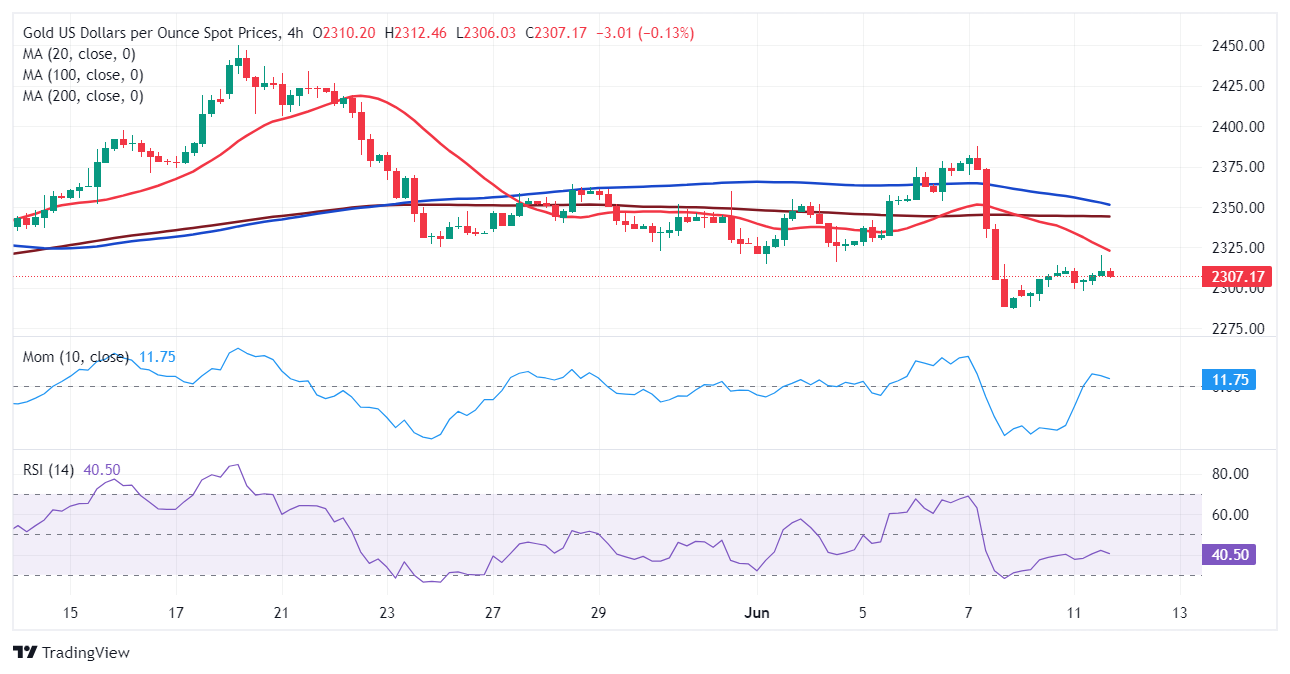
In the near term, according to the 4-hour chart, the technical picture favors a downward extension. A firmly bearish 20 SMA cap advances while extending its slide below the 100 and 200 SMAs. Finally, technical indicators gain downward traction between negative levels, although not strong enough to suggest a break below the recent lows.
Support levels: 2,300.00 2,286.60 2,272.90
Resistance levels: 2,315.50 2,328.40 2,342.35
Information on these pages contains forward-looking statements that involve risks and uncertainties. Markets and instruments profiled on this page are for informational purposes only and should not in any way come across as a recommendation to buy or sell in these assets. You should do your own thorough research before making any investment decisions. FXStreet does not in any way guarantee that this information is free from mistakes, errors, or material misstatements. It also does not guarantee that this information is of a timely nature. Investing in Open Markets involves a great deal of risk, including the loss of all or a portion of your investment, as well as emotional distress. All risks, losses and costs associated with investing, including total loss of principal, are your responsibility. The views and opinions expressed in this article are those of the authors and do not necessarily reflect the official policy or position of FXStreet nor its advertisers. The author will not be held responsible for information that is found at the end of links posted on this page.
If not otherwise explicitly mentioned in the body of the article, at the time of writing, the author has no position in any stock mentioned in this article and no business relationship with any company mentioned. The author has not received compensation for writing this article, other than from FXStreet.
FXStreet and the author do not provide personalized recommendations. The author makes no representations as to the accuracy, completeness, or suitability of this information. FXStreet and the author will not be liable for any errors, omissions or any losses, injuries or damages arising from this information and its display or use. Errors and omissions excepted.
The author and FXStreet are not registered investment advisors and nothing in this article is intended to be investment advice.
Recommended Content
Editors’ Picks

EUR/USD regains traction and retargets 1.1000
The US Dollar accelerates its decline in the epilogue of the NA session on Tuesday, lending broad support to the risk-linked space and sending EUR/USD to the 1.0980 region, near daily peaks.

GBP/USD looks bid and approaches 1.2800
GBP/USD maintains its fresh bullish bias in the upper-1.2700s, printing marked gains in response to some loss of impulse in the US Dollar, which in turn lent fresh legs to the risk-associated universe on Tuesday.

Gold trims gains and breaches $3,000
Gold prices now lose some upside momentum and slip back below the critical $3,000 mark per troy ounce. Tuesday's recovery in the yellow metal comes on the back of the weaker US Dollar as well as steady trade tensions, while higher US yields continue to cap gains.

Who is Satoshi? Crypto lawyer sues DHS to reveal Satoshi Nakamoto's identity
James Murphy, a cryptocurrency lawyer popularly known to his followers on X as "MetalLawMan," has filed a lawsuit in a D.C. District Court against the Department of Homeland Security (DHS). He intends to uncover the real face or faces behind Satoshi Nakamoto, the pseudonymous creator of Bitcoin.

The Fed is looking at a hefty price level
We are still in thrall to tariffs, the faux-macro “data” driving markets. The WSJ editorial board advised other countries to take their tariffs to zero so that Trump’s “reciprocal” tariffs will have to be zero, too. Cute, but no cigar.

The Best brokers to trade EUR/USD
SPONSORED Discover the top brokers for trading EUR/USD in 2025. Our list features brokers with competitive spreads, fast execution, and powerful platforms. Whether you're a beginner or an expert, find the right partner to navigate the dynamic Forex market.