Gold Price Forecast: XAU/USD loses its shine, approaches $2,600

XAU/USD Current price: $2,609.43
- FOMC Meeting Minutes and Fedspeak take centre stage in the American afternoon.
- The market mood soured on talks US authorities could seek a Google breakout.
- XAU/USD pressures its weekly lows and gains downward traction in the near term.
Spot Gold fell to $2,604.66 on Tuesday, bouncing modestly afterwards. The XAU/USD pair nears such a low early in the American session as investors await the Federal Open Market Committee (FOMC) Meeting Minutes and Fedspeak.
The hope that the document can shed some new light on future monetary policy, however, seems unjustified. Much water has run below the bridge ever since the Fed announced a 50 basis points (bps) interest rate cut when it met in September.
The most notorious game-changer was the latest Nonfarm Payrolls (NFP) report, which showed the country added over 250,000 new job positions in September and that the Unemployment rate decreased to 4.1% from the previous 4.2%. Following the announcement, market participants reduced bets for a potential 50 bps rate cut in November, helping the US Dollar regain its poise.
The FOMC Minutes will reflect policymakers’ thoughts before solid employment-related data. As for Fed speakers, most have already hit the wires in the Fed’s aftermath and are unlikely to deliver different comments from those already heard.
Meanwhile, markets are in a risk-off mood. Fading excitement about Chinese stimulus undermined local share markets, while news that the US Department of Justice considers a possible breakup of Google also weighs on stock markets. Wall Street trades mixed, with only the S&P500 holding on to modest gains.
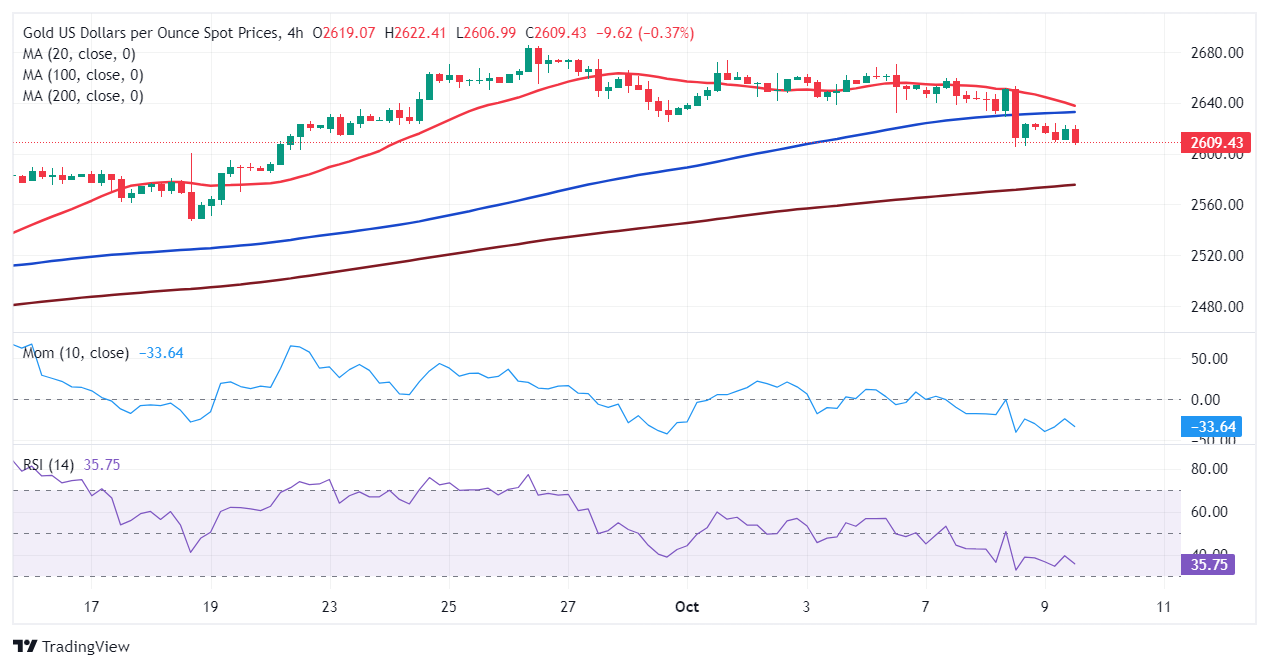
XAU/USD short-term technical outlook
The XAU/USD pair daily chart shows it is down for a sixth consecutive day, with an increased bearish potential. Technical indicators offer firmly bearish slopes, although still above their midlines, while the bright metal currently develops below a still bullish 20 Simple Moving Average (SMA). The 100 and 200 SMAs, in the meantime, remain far below the current level, maintaining their upward slopes.
In the near term, and according to the 4-hour chart, the bearish case is stronger. A bearish 20 SMA is about to cross below a mostly flat 100 SMA, both at around 2,635. Technical indicators, in the meantime, have accelerated south within negative levels, in line with continued selling pressure.
Support levels: 2,603.90 2,589.10 2,575.20
Resistance levels: 2,625.40 2,637.10 2,652.90
Premium
You have reached your limit of 3 free articles for this month.
Start your subscription and get access to all our original articles.
Author

Valeria Bednarik
FXStreet
Valeria Bednarik was born and lives in Buenos Aires, Argentina. Her passion for math and numbers pushed her into studying economics in her younger years.


