Gold Price Forecast: XAU/USD looks to more US data for a fresh directional impetus
- Gold price remains capped below the key $2,670 resistance, despite the escalating Israel-Iran conflict.
- The US Dollar stands tall on reduced bets for an outsized Fed rate cut in November.
- Gold price could struggle for bullish traction ahead of top-tier US economic data, Fedspeak.

Gold price is trading listlessly in a narrow range under the key $2,670 static resistance, lacking a clear directional impetus so far this Thursday. The focus now shifts toward a fresh batch of US economic statistics and speeches from Federal Reserve (Fed) policymakers for fresh directives amid the escalating geopolitical conflict between Israel and Iran.
Gold price divided between Mideast woes and smaller Fed rate cut bets
Several media outlets reported that Israel delivered a harsh response to the recent Iranian attack by bombing central Beirut in the early hours of Thursday. Lebanese security officials said that three missiles also struck the southern suburb of Dahiyeh, the place of Hezbollah leader Hassan Nasrallah's killing. Lebanese health officials also reported that multiple people were injured following Israel’s strike in Beirut.
Iranian forces on Tuesday used hypersonic Fattah missiles for the first time and 90% of its missiles successfully hit their targets in Israel. Tehran said this attack was in response to Israeli killings of militant leaders and aggression in Lebanon against the Iran-backed armed movement Hezbollah and in Gaza.
Despite the increasing risks of the Israel-Iran conflict turning into a wider regional war in the Middle East, Gold price is struggling to capitalize on the risk-off flows, as diminishing odds of a 50 basis points (bps) interest rate cut by the Fed in November keep the sentiment around the US Dollar underpinned at the expense of the non-interest-bearing Gold price.
Data on Wednesday showed that US ADP private sector employment increased by 143,000 jobs for September, accelerating from the upwardly revised 103,000 in August and better than the 120,000 estimate. Strong ADP jobs report eased concerns about the health of the US labor market, supporting the expectations for Friday’s Nonfarm Payrolls data.
Markets are currently pricing in about a 34% chance that the Fed will opt for a big rate cut at its next meeting, compared with almost 60% last week, CME Group's FedWatch Tool shows.
Next of note for Gold traders remain the US ISM Services PMI and the weekly Jobless Claims data for fresh signals on the state of the economy and the Fed’s next interest rate move. Also, Fedspeak will be closely scrutinized and will likely have a significant impact on the US Dollar valuation, eventually influencing the Gold price action.
Gold price technical analysis: Daily chart
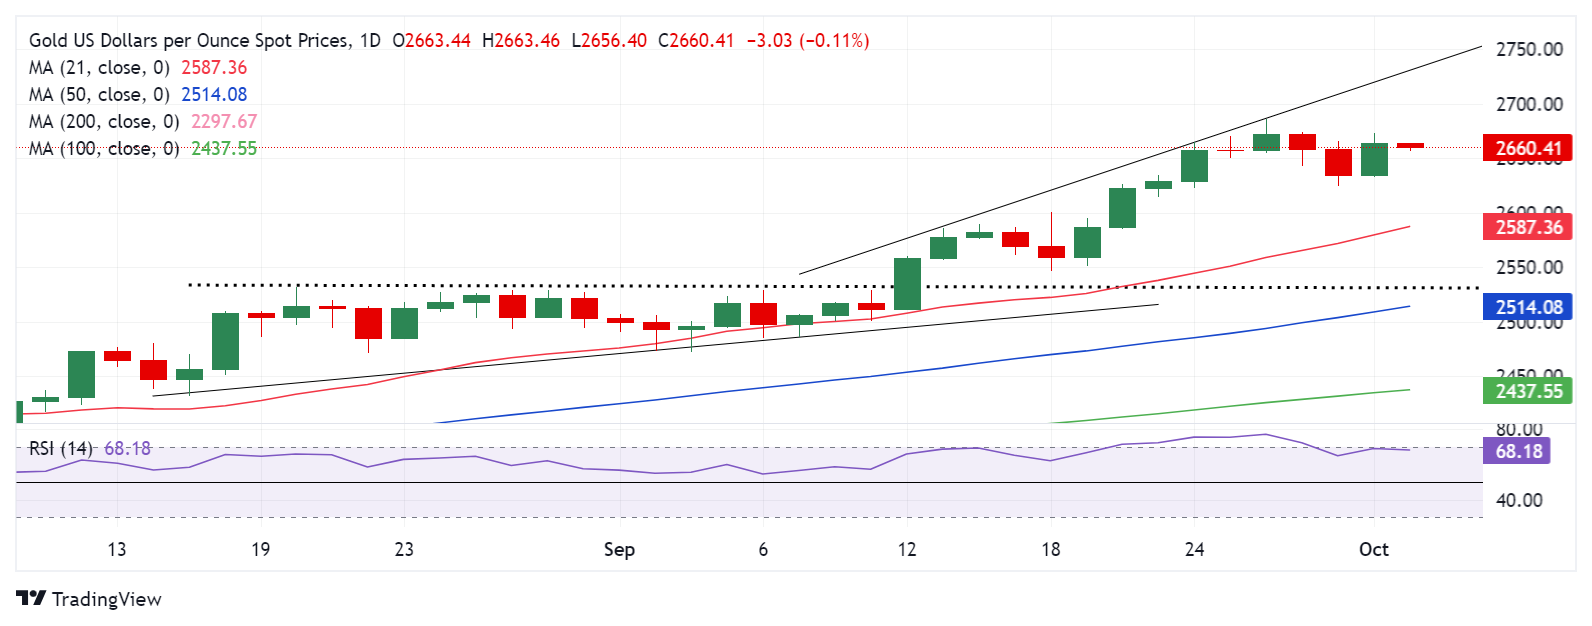
The daily technical setup for Gold price remains constructive so long as the 14-day Relative Strength Index (RSI) remains in the bullish territory. The leading indicator is currently trading near 66.50.
Gold price needs to yield a daily candlestick closing above the static resistance near $2,670 for a renewed upside. The next resistance is aligned at the record high of $2,686.
Furrther up, buyers will target the $2,700 round level, followed by the rising trendline resistance at $2,740.
Alternatively, if Gold sellers flex their muscles, acceptance below the September 24 low of $2,623 is critical to unleashing further downside toward the $2,600 threshold.
Gold sellers could then challenge the September 20 low of $2,585, where the 21-day Simple Moving Average (SMA) hangs around.
Economic Indicator
ISM Services PMI
The Institute for Supply Management (ISM) Services Purchasing Managers Index (PMI), released on a monthly basis, is a leading indicator gauging business activity in the US services sector, which makes up most of the economy. The indicator is obtained from a survey of supply executives across the US based on information they have collected within their respective organizations. Survey responses reflect the change, if any, in the current month compared to the previous month. A reading above 50 indicates that the services economy is generally expanding, a bullish sign for the US Dollar (USD). A reading below 50 signals that services sector activity is generally declining, which is seen as bearish for USD.
Read more.Next release: Thu Oct 03, 2024 14:00
Frequency: Monthly
Consensus: 51.7
Previous: 51.5
Source: Institute for Supply Management
The Institute for Supply Management’s (ISM) Services Purchasing Managers Index (PMI) reveals the current conditions in the US service sector, which has historically been a large GDP contributor. A print above 50 shows expansion in the service sector’s economic activity. Stronger-than-expected readings usually help the USD gather strength against its rivals. In addition to the headline PMI, the Employment Index and the Prices Paid Index numbers are also watched closely by investors as they provide useful insights regarding the state of the labour market and inflation.
Premium
You have reached your limit of 3 free articles for this month.
Start your subscription and get access to all our original articles.
Author

Dhwani Mehta
FXStreet
Residing in Mumbai (India), Dhwani is a Senior Analyst and Manager of the Asian session at FXStreet. She has over 10 years of experience in analyzing and covering the global financial markets, with specialization in Forex and commodities markets.


