Gold Price Forecast: XAU/USD is closely monitoring geopolitics
- XAU/USD resumes its upside bias amidst geopolitical jitters.
- Rising US yields should limit the metal’s upside potential.
- The central bank's divergence remain in centre stage.

Prices of the yellow metal left behind two consecutive daily pullbacks and posted decent gains on Thursday, although another test or surpass of the $2,400 mark per troy ounce remained elusive.
On another front, the US markets kicked off the session in a mixed tone amidst dominating risk-off sentiment that saw the Greenback regain its composure following Wednesday’s marked retracement. A glimpse to other markets showed Asian stocks edging higher and European equities trading mostly on the defensive, while market participants continued to assess the financial meeting between the US, Japan, and South Korea, where these countries pledged to “engage in close consultation" regarding FX markets, after concerns from Tokyo and Seoul regarding the recent significant depreciation of their currencies.
Furthermore, the move higher in bullion came exclusively on the back of escalating geopolitical tensions in the Middle East after Israel is contemplating retribution against Iran after the latter launched a huge attack over the weekend.
In the meantime, US yields regained their smile and rose across the curve, maintaining their trade in the upper end of the recent range
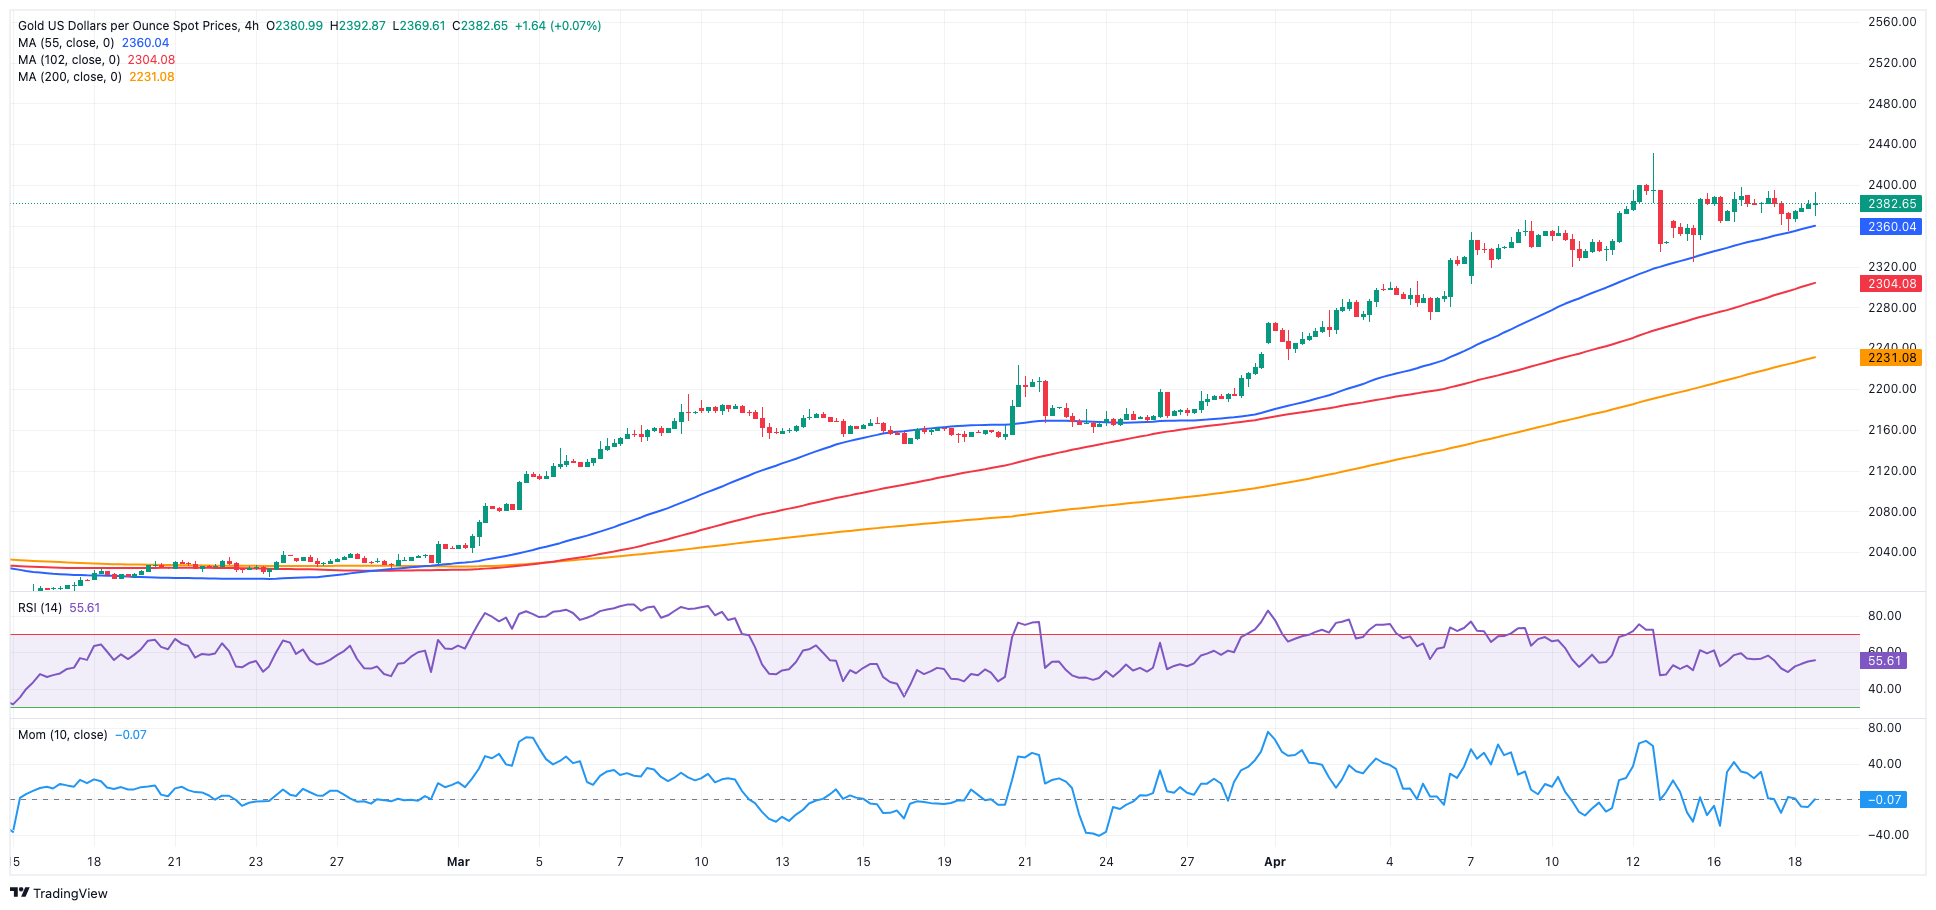
XAU/USD short-term technical outlook
XAU/USD regains the upside traction and approaches the $2,400 mark, showing some near-term consolidation for the time being. Technical indicators retreat from extreme overbought levels, suggesting that some decline may lie ahead in the short term. Still, a steeper slide remains out of the picture, as XAU/USD refuses to give up while developing its moving averages above all. On this, the 55-day SMA hovers around $2,150 while the 100-day SMA tests the $2,100 zone.
The 4-hour chart shows XAU/USD moving further into a consolidative phase, which appears so far capped by the $2,400 level, while the 55-SMA holds the downside for the time being. The longer moving averages maintain their bullish slopes far below the current spot levels, while the Relative Strength Index (RSI) indicator points slightly southwards around 55.
Support levels: 2,359.80 2,345.20 2,333.20
Resistance levels: 2,380.70 2,393.50 2,409.20
Author

Pablo Piovano
FXStreet
Born and bred in Argentina, Pablo has been carrying on with his passion for FX markets and trading since his first college years.