Gold Price Forecast: XAU/USD hovers around $2,660 after US opening

XAU/USD Current price: $2,656.69
- Geopolitical tensions in the Middle East undermined the market mood on Wednesday.
- The US ADP report hinted at a resilient labor market, hints at modest interest rate cuts.
- XAU/USD aims to resume its advance in the near term, resistance at around $2,670.
Spot Gold hovers around $2,650 a troy ounce on Wednesday, confined to a tight trading range amid a generally pessimistic market mood favoring both Gold and the US Dollar (USD). The Middle East conflict, with Israel and Iran launching back-and-forth attacks, weighs on investors’ mood. Fears of supply disruptions push crude oil prices higher and speculative interest into safe-haven assets. Stock markets traded mixed in Asia and Europe, as the massive Chinese stimulus announced last week partially offsets geopolitical tensions.
Wall Street opened mixed, with only the Dow Jones Industrial Average (DJIA) trading in positive territory, up a modest 0.02% at the time of writing. The Nasdaq Composite and the S&P500 trade in the red, albeit losses are modest. American traders are digesting United States (US) employment data, as the ADP report on private job creation showed 143,000 new positions were added in September, better than the 120,000 anticipated by market participants.
The encouraging figures back the Greenback ahead of the September Nonfarm Payrolls report to be released on Friday. Federal Reserve (Fed) officials expressed concerns about the employment situation, shifting the focus away from inflation. Generally speaking policymakers are confident about inflation moving towards their 2% goal. However, the once-hot job market has lost steam over the last few months, and softer-than-anticipated figures could prompt the Fed into more aggressive rate cuts. That’s not the case following the ADP release, one of the reasons US indexes stay afloat.
XAU/USD short-term technical outlook
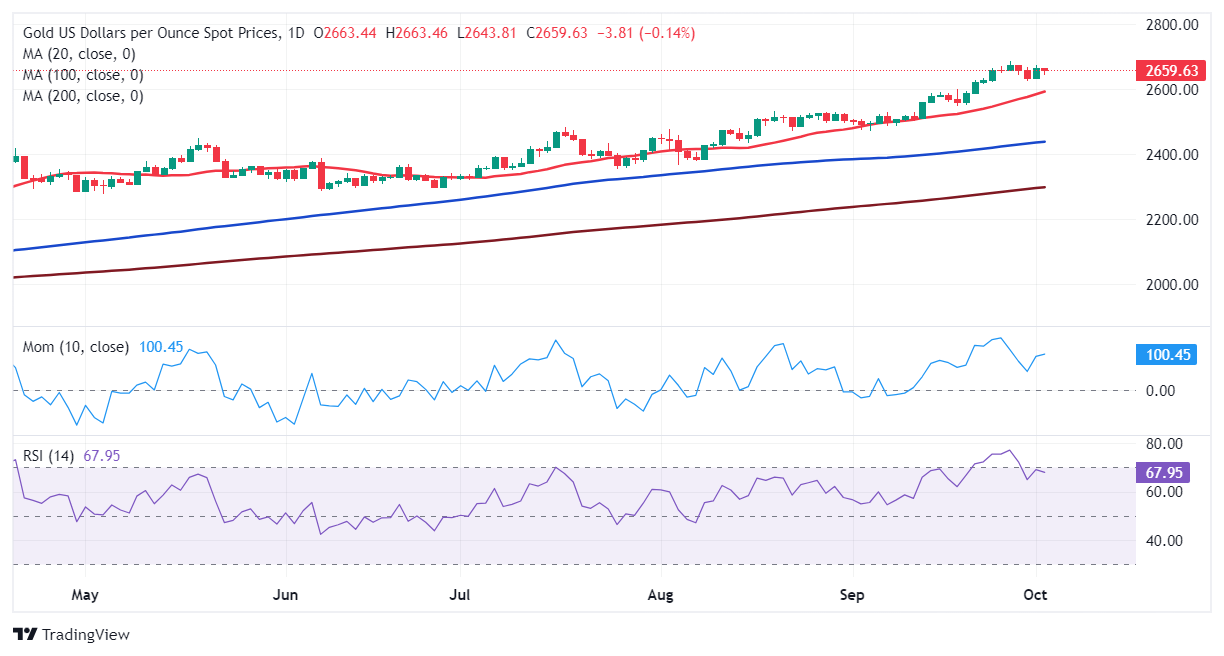
The daily chart for XAU/USD shows it trimmed early losses and hover around its opening. Moving averages head firmly north, far below the current level, maintaining the long-term bullish trend alive. Technical indicators, in the meantime, turned lower, although they stand far above their midlines and with limited downward strength, falling short of suggesting a steeper decline.
In the near term, and according to the 4-hour chart, XAU/USD is aiming to resume its advance. The pair is trading just above a flat 20 SMA, while the 100 and 200 SMAs aim higher far below the shorter one, all supportive of a bullish extension. Finally, technical indicators resumed their advances and are currently crossing their midlines into positive territory, reflecting increased buying interest.
Support levels: 2,652.60 2,638.10 2,623.25
Resistance levels: 2,670.00 2,685.00 2,700.00
Premium
You have reached your limit of 3 free articles for this month.
Start your subscription and get access to all our original articles.
Author

Valeria Bednarik
FXStreet
Valeria Bednarik was born and lives in Buenos Aires, Argentina. Her passion for math and numbers pushed her into studying economics in her younger years.


