XAU/USD Current price: $2,341.03
- The yield on the 10-year Treasury note hit its highest since mid-2023.
- Tensions between Israel and Iran undermine the market mood.
- XAU/USD consolidates around its daily opening, may extend its corrective slide.
Gold consolidates around $2,350 a troy ounce on Monday, struggling to find directional strength in a risk-averse environment. XAU/USD hit an all-time high of $2,431.43 on Friday but closed the day in the red amid continued US Dollar demand combined with profit-taking ahead of the weekly close.
Weekend news kept concerns alive as Iran launched a massive attack on Israel, spurring fears of an Israeli retaliation. Western allies called for the latter to avoid escalating the conflict, but it’s unclear what Israeli Prime Minister Benjamin Netanyahu could do next. Netanyahu is discussing with its cabinet whether or not they will hit back at Iran. Tensions affected Oil prices the most but also backed demand for the Greenback.
The US Dollar is also benefiting from running Treasury yields. The 10-year note currently offers 4.64%, up 13 basis points (bps) and its highest since June 2023. The 2-year note yields 4.94%, up modest 6 bps. Meanwhile, Wall Street battles to reverse Friday’s losses, with the three major indexes trading mixed.
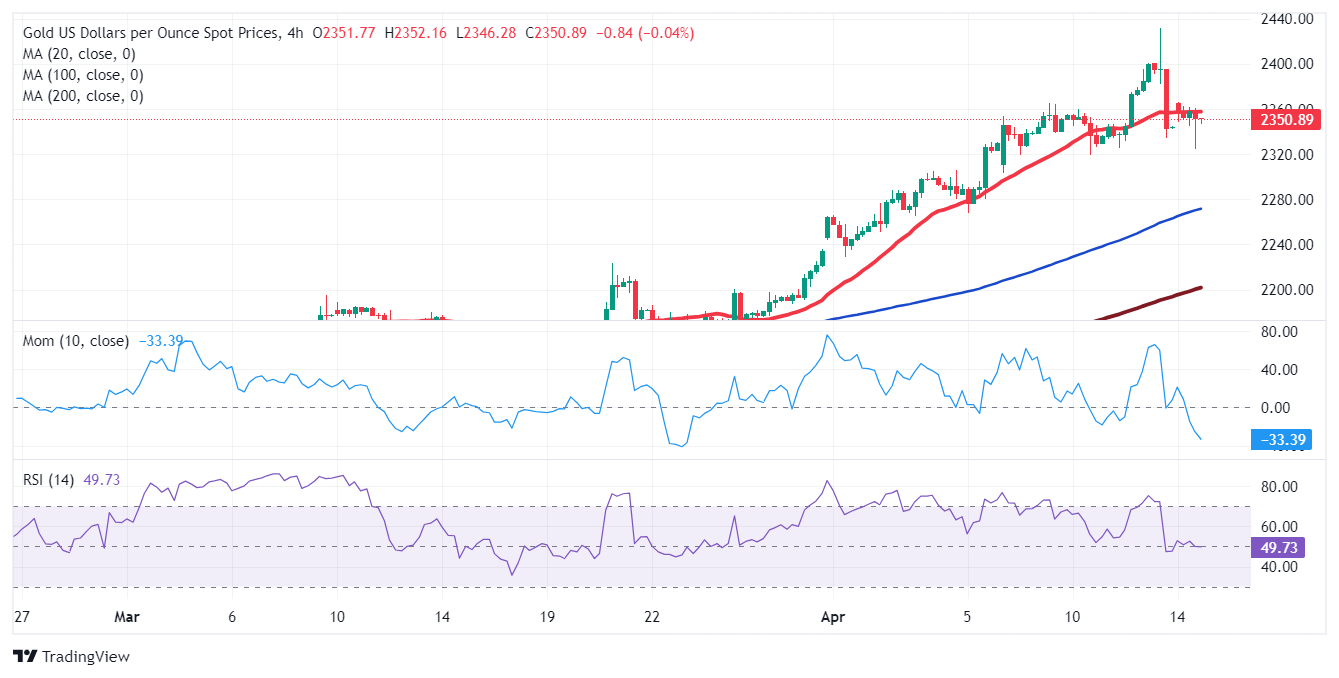
XAU/USD short-term technical outlook
The daily chart for the XAU/USD pair shows it may extend its corrective slide. The pair posted a lower low and lower high but remains above all its moving averages, with a firmly bullish 20 Simple Moving Average (SMA) providing dynamic support at around $2,259.00. Technical indicators, in the meantime, retreated from their recent highs but remain within overbought readings.
In the near term, and according to the 4-hour chart, the risk of a downward extension has increased. A flat 20 SMA caps advances at around $2,356.00, while the longer moving averages are partially losing their upward momentum. The Momentum indicator stands just above its 100 level trying to resume its advance, while the Relative Strength Index (RSI) indicator gains downward traction around 49. The bearish case will be stronger if XAU/USD breaks through $2,319.20, a strong support level.
Support levels: 2,333.80. 2,319.20 2,303.80
Resistance levels: 2,356.10 2,365.25 2,380.00
Information on these pages contains forward-looking statements that involve risks and uncertainties. Markets and instruments profiled on this page are for informational purposes only and should not in any way come across as a recommendation to buy or sell in these assets. You should do your own thorough research before making any investment decisions. FXStreet does not in any way guarantee that this information is free from mistakes, errors, or material misstatements. It also does not guarantee that this information is of a timely nature. Investing in Open Markets involves a great deal of risk, including the loss of all or a portion of your investment, as well as emotional distress. All risks, losses and costs associated with investing, including total loss of principal, are your responsibility. The views and opinions expressed in this article are those of the authors and do not necessarily reflect the official policy or position of FXStreet nor its advertisers. The author will not be held responsible for information that is found at the end of links posted on this page.
If not otherwise explicitly mentioned in the body of the article, at the time of writing, the author has no position in any stock mentioned in this article and no business relationship with any company mentioned. The author has not received compensation for writing this article, other than from FXStreet.
FXStreet and the author do not provide personalized recommendations. The author makes no representations as to the accuracy, completeness, or suitability of this information. FXStreet and the author will not be liable for any errors, omissions or any losses, injuries or damages arising from this information and its display or use. Errors and omissions excepted.
The author and FXStreet are not registered investment advisors and nothing in this article is intended to be investment advice.
Recommended Content
Editors’ Picks
EUR/USD flirts with daily tops near 1.0730
The continuation of the selling pressure in the Greenback now lends further oxygen to the risk complex, encouraging EUR/USD to revisit the area of daily highs near 1.0730.
USD/JPY looks stable around 156.50 as suspicious intervention lingers
USD/JPY remains well on the defensive in the mid-156.00s albeit off daily lows, as market participants continue to digest the still-unconfirmed FX intervention by the Japanese MoF earlier in the Asian session.
Gold advances for a third consecutive day
Gold fluctuates in a relatively tight channel above $2,330 on Monday. The benchmark 10-year US Treasury bond yield corrects lower and helps XAU/USD limit its losses ahead of this week's key Fed policy meeting.
Week Ahead: Bitcoin could surprise investors this week Premium
Two main macroeconomic events this week could attempt to sway the crypto markets. Bitcoin (BTC), which showed strength last week, has slipped into a short-term consolidation.
Five Fundamentals for the week: Fed fears, Nonfarm Payrolls, Middle East promise an explosive week Premium
Higher inflation is set to push Fed Chair Powell and his colleagues to a hawkish decision. Nonfarm Payrolls are set to rock markets, but the ISM Services PMI released immediately afterward could steal the show.