Gold Price Forecast: XAU/USD hovers around $2,330 as demand for the USD recedes

XAU/USD Current price: $2,329.40
- United States Retail Sales missed expectations, Industrial Production resulted upbeat.
- US indexes maintain a positive tone after posting gains on Monday.
- XAU/USD approaches its comfort zone at around $2,330, with modest upward strength.
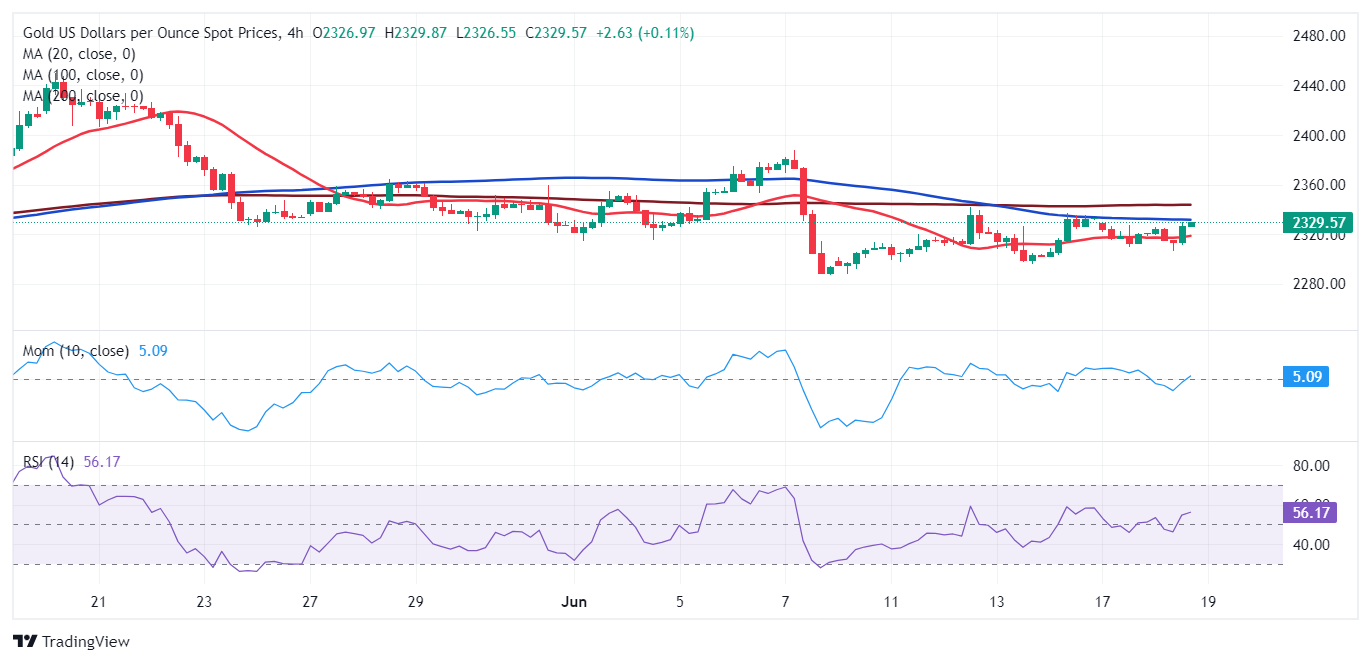
Spot Gold trades near $2,330 a troy ounce, with XAU/USD trimming early early losses. The pair fell towards the $2,300 mark throughout European trading hours, turning north following the release of United States (US) macroeconomic data. The country reported that Retail Sales rose a measly 0.1% in May, missing the 0.2% advance expected. Furthermore, the April reading was downwardly revised from 0.0% to -0.2%.
However, the US also released May Industrial Production data, which beat expectations by surging 0.9% MoM. Capacity Utilization in the same period rose 78.7%, better than the previous 78.2% and the 78.6% forecast.
The mixed news did little to change the generally optimistic mood among American investors. Wall Street closed in the green on Monday, and US indexes maintain the positive trajectory on Tuesday, with the Dow Jones Industrial Average and the S&p 500 extending weekly gains. The Nasdaq Composite, on the contrary, is down 16 points. As a result, the US Dollar is under near-term pressure against most of its major rivals.
XAU/USD short-term technical outlook
From a technical point of view, XAU/USD has made no progress. It trades within familiar levels for a second consecutive week. The daily chart shows it's still developing below a bearish 20 SMA, providing dynamic resistance at around $2,335.00. At the same time, technical indicators have turned marginally lower but remain within negative levels, suggesting buying interest is not enough to trigger a bullish extension.
The near-term picture is neutral, although the risk skews to the upside. In the 4-hour chart, XAU/USD trades above a flat 20 SMA but below the 100 and 200 SMAs. The Momentum indicator aims modestly higher above its 100 line, while the Relative Strength Index (RSI) indicator aims north with more strength, standing at around 55.
Support levels: 2,314.25 2,298.10 2,286.70
Resistance levels: 2,335.00 2,351.90 2,366.30
Author

Valeria Bednarik
FXStreet
Valeria Bednarik was born and lives in Buenos Aires, Argentina. Her passion for math and numbers pushed her into studying economics in her younger years.