Gold Price Forecast: XAU/USD holding at higher ground at around $2,670

XAU/USD Current price: $2,669.02
- Generally encouraging US data gave the Greenback a short-term boost.
- Federal Reserve officials refrained from commenting on monetary policy.
- XAU/USD is poised to extend its advance, although the risk of a downward correction increased.
Spot Gold hit $2,685.45 on Thursday, yet another record high. XAU/USD currently trades around $2,671 as investors keep selling the battered US Dollar (USD). The United States (US) published some macroeconomic encouraging figures, albeit nothing shocking. The numbers provided temporal support to the USD at the beginning of the American session, but the Greenback quickly resumed its decline.
The US reported that Initial Jobless Claims for the week ended September 20 rose by 218K, better than the 219K previous and the 225K expected. Also, the country confirmed an annualized pace of growth of 3% in the year to June, according to the final estimate of the Q2 Gross Domestic Product (GDP). Finally, Durable Goods Orders posted 0.0% in August, better than the -2.6% expected.
Meanwhile, multiple Federal Reserve (Fed) officials hit the wires in different events. Nevertheless, no one delivered fresh hints on monetary policy. In fact, most refrained from discussing it after cutting interest rates by a whopping 50 basis points (bps) when they met last week. Such silence left speculative interest in its belief that policymakers would deliver a similar trim in November.
Further harming the USD, Wall Street turned positive. After the back and forth offered in the first half of the week, US indexes seem to have found their way north.
XAU/USD short-term technical outlook
The daily chart for XAU/USD shows it keeps posting higher lows and higher highs, supporting another leg north. Technical indicators, in the meantime, head firmly north within overbought levels, showing no signs of upward exhaustion yet, Meanwhile the pair keeps developing above firmly bullish moving averages which stand far below the current level. Overall, the risk of a downward correction has increased despite the lack of technical signs about it.
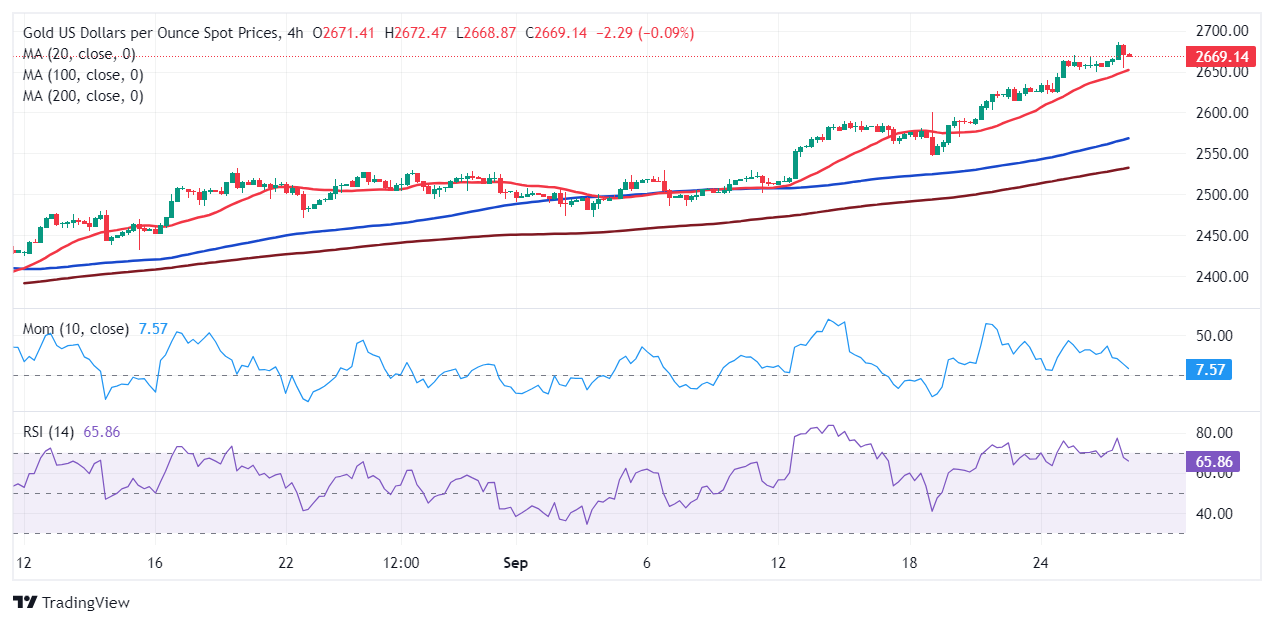
In the near term, and according to the 4-hour chart, it is clear that bulls retain control. An intraday slide met buyers around a bullish 20 Simple Moving Average (SMA), now providing dynamic support at around 2,650. At the same time, the 100 and 200 SMAs accelerated higher, far below the shorter ones, reflecting persistent upside strength. Finally, the Momentum indicator aims marginally higher within positive levels, while the Relative Strength Index (RSI) indicator retreats modestly from extreme overbought readings, drawing minor divergences. Such divergences seem not enough to support a decline but are a first warning about a potential decline in the upcoming sessions.
Support levels: 2,662.80 2,650.00 2,638.10
Resistance levels: 2,685.00 2,700.00 2,715.00
Premium
You have reached your limit of 3 free articles for this month.
Start your subscription and get access to all our original articles.
Author

Valeria Bednarik
FXStreet
Valeria Bednarik was born and lives in Buenos Aires, Argentina. Her passion for math and numbers pushed her into studying economics in her younger years.


