Gold Price Forecast: XAU/USD fresh record highs at sight

XAU/USD Current price: $2,675.01
- Sentiment led the way on Wednesday amid scarce macroeconomic data.
- Focus shifts to the European Central Bank monetary policy decision on Thursday.
- XAU/USD aims to reach fresh record highs and challenge the $2,700 mark.
Risk aversion keeps fueling Gold demand, with the bright metal flirting with record highs on Wednesday. XAU/USD peaked at $2,685.25 on Wednesday despite broad US Dollar (USD) strength against other major currencies. The latter has gained extra strength after Wall Street’s opening, resulting in XAU/USD pulling back from the mentioned high yet still holding to modest intraday gains.
A dismal market mood prevailed throughout the first half of the day, with Asian and European indexes edging lower, following softer-than-anticipated earning reports in the Old Continent. Wall Street, however, managed to revert the sentiment, as the three major indexes stand in the green.
Speculative interest keeps looking at Middle East developments and China for guidance, given the absence of first-tier macroeconomic figures this week, yet headlines are also scarce on those fronts. On the one hand, the missile barrage between Israel and Iran continues, with fears the attacks will reach nuclear or oil plants. On the other hand, the Chinese government has bluffed about stimulus measures to revive the economy but failed to provide enough details on the matter.
If something, the European Central Bank (ECB) may trigger some action on Thursday, as the central bank will announce its decision on monetary policy. The ECB is widely anticipated to deliver a third consecutive interest rate cut. The Main Refinancing Operations Rate and the Rate on Deposit Facility are foreseen down by 25 basis points (bps) each amid struggling economic progress.
XAU/USD short-term technical outlook
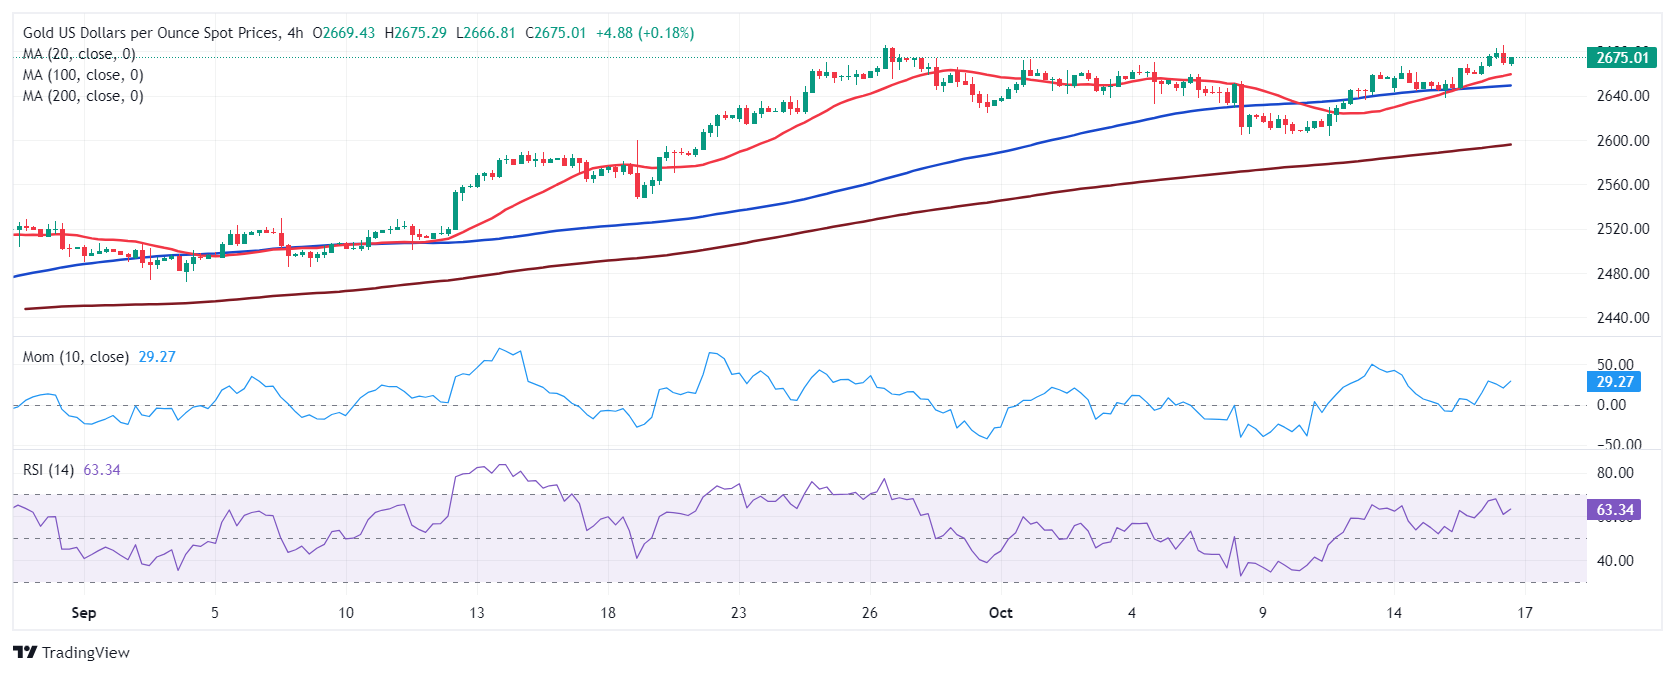
From a technical point of view, the XAU/USD pair is poised to extend its advance and challenge the $2,700 mark. In the daily chart, the pair is up for a second consecutive day, with a bullish 20 Simple Moving Average (SMA) providing dynamic support at around $2,644.10. In the same chart, the longer moving averages also maintain their bullish slopes far below the shorter one, reflecting the long-term positive stance. Finally, the Momentum indicator turned flat around its 100 line, while the Relative Strength Index (RSI) indicator keeps grinding higher, currently at around 64, in line with bulls’ dominance.
In the near term, and according to the 4-hour chart, the risk skews to the upside. A bullish 20 SMA runs above its 100 SMA, while the 200 SMA grinds higher below the shorter ones, usually understood as growing momentum. At the same time, technical indicators have resumed their advances within positive levels after a modest corrective decline.
Support levels: 2,668.80 2,655.65 2,644.10
Resistance levels: 2,685.45 2,700.00 2,715.00
Author

Valeria Bednarik
FXStreet
Valeria Bednarik was born and lives in Buenos Aires, Argentina. Her passion for math and numbers pushed her into studying economics in her younger years.

















