Gold Price Forecast: XAU/USD extends rally above $2,700

XAU/USD Current price: $2,716.87
- The Bank of Canada trimmed rates by 50 bps, the European Central Bank is next.
- United States inflation rose at the anticipated pace in November.
- XAU/USD bullish momentum set to continue toward record highs in the $2,790 region.
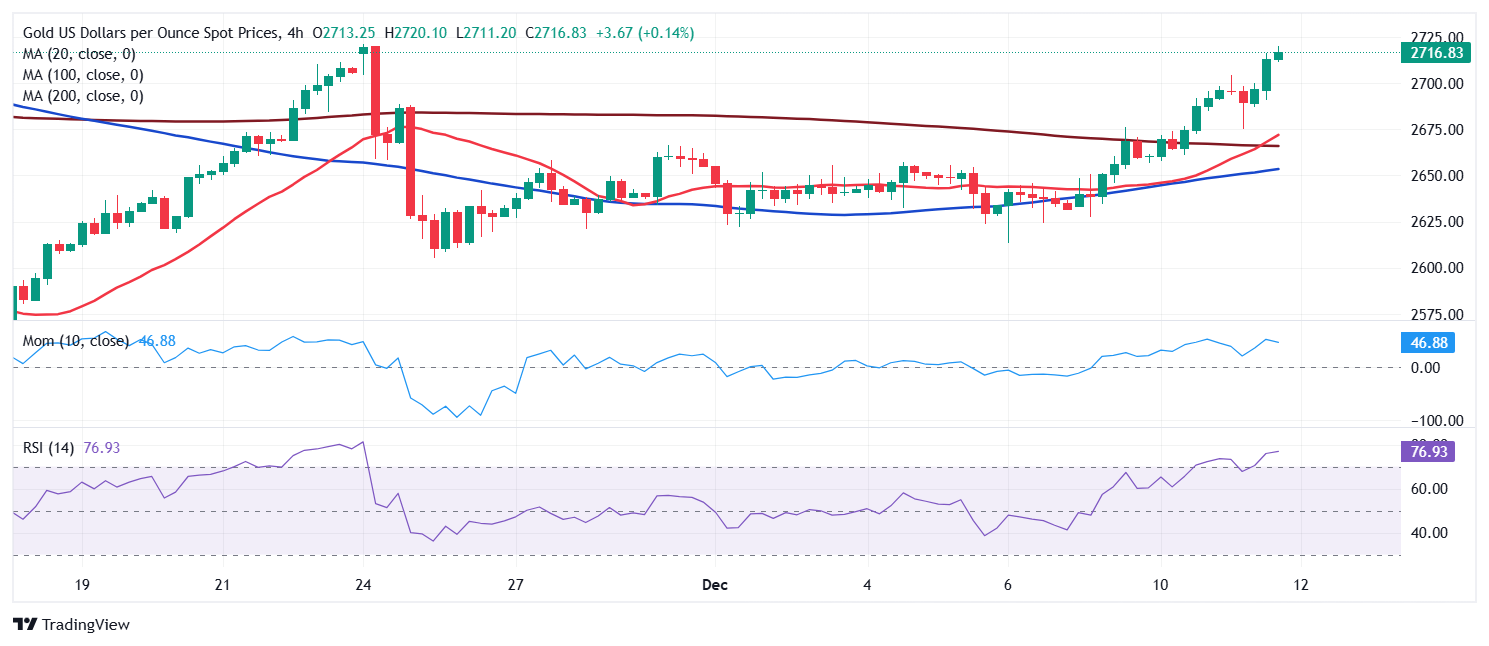
Gold is among the best performers against the US Dollar (USD) on Wednesday, changing hands at around $2.712 a troy ounce in the American session. The Greenback seesawed between gains and losses throughout the day but ended up firming up against most major rivals, but the bright metal and the Canadian Dollar (CAD), the latter firmer amid the Bank of Canada (BoC) decision to trim interest rates by 50 basis points (bps).
BoC Governor Tiff Macklem spoke after the announcement and said: “We anticipate a more gradual approach to monetary policy if the economy evolves broadly as expected.” He added that monetary policy no longer needs to be in restrictive territory, anticipating a more gradual approach to monetary policy if the economy evolves broadly as expected.
Meanwhile, the United States (US) published an update on the Consumer Price Index (CPI). The index rose by 2.7% on a yearly basis in November. Compared to the previous month, the CPI increased 0.3%, while the annual core reading printed at 3.3%. The readings were in line with the market’s estimates, pushing the US Dollar temporarily, as investors lifted bets the Federal Reserve (Fed) will trim the main benchmark interest rate by 25 bps when it meets next week.
Coming up next is the European Central Bank (ECB), scheduled to deliver its decision on monetary policy on Thursday. Also, Australia will release its monthly employment report in the upcoming Asian session.
XAU/USD short-term technical outlook
From a technical point of view, XAU/USD is on its way to retest the record high at around $2,790. In the daily chart, the pair extends its advance above a now bullish 20 Simple Moving Average (SMA), while 100 and 200 SMAs maintain their upward strength below the longer ones. At the same time, technical indicators advance within positive levels, albeit with uneven momentum, still supporting another leg north.
In the near term, the risk skews to the upside. Technical readings in the 4-hour chart show the pair reached overbought conditions, but there are no solid signs of an upcoming corrective decline. The Momentum indicator consolidates well above its midline, while the Relative Strength Index (RSI) indicator heads north at around 72. Finally, the pair develops above all its moving averages, with the 20 SMA crossing above the 200 SMA, usually a sign of additional gains ahead.
Support levels: 2,704.25 2,689.80 2,672.35
Resistance levels: 2,722.60 2,735.90 2,751.00
Author

Valeria Bednarik
FXStreet
Valeria Bednarik was born and lives in Buenos Aires, Argentina. Her passion for math and numbers pushed her into studying economics in her younger years.