Gold Price Forecast: XAU/USD eases despite risk-off mood

XAU/USD Current price: $2,370.03
- Financial markets struggle with sentiment amid Middle East tensions, on-hold central banks.
- US Government bond yields are in retreat mode after reaching fresh 2024 highs.
- XAU/USD giving modest signs of an imminent bearish correction.
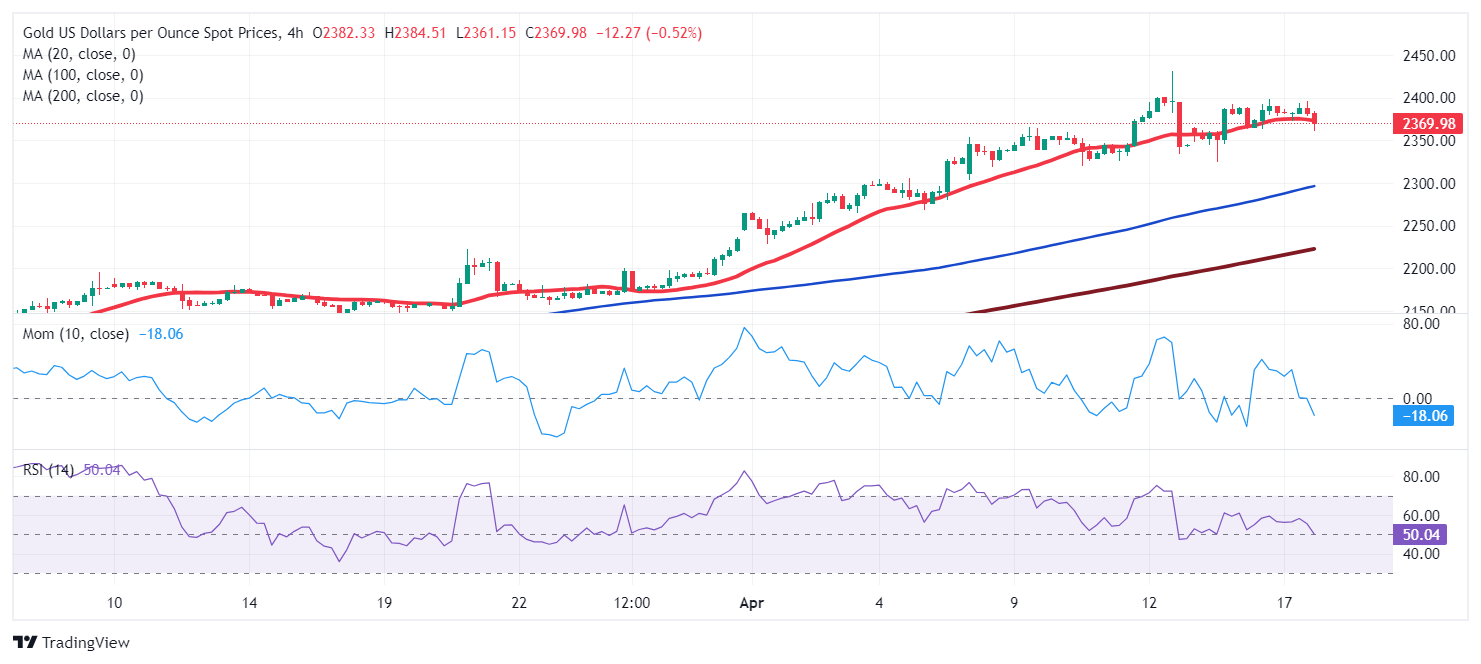
Spot Gold eased on Wednesday after being unable to surpass the $2,400 mark for a second consecutive day. The US Dollar trades marginally lower against its major rivals despite resurgent risk aversion following Wall Street’s opening. Asian stocks traded mixed, but European indexes were mostly up, as market players seemed to accept interest rate cuts in the United States (US) are on hold for now. However, US indexes quickly turned south at the beginning of the session, undermining the sentiment.
Tensions in the Middle East weigh on the mood. Israel is preparing some retaliation on Iran after the latter launched a massive attack over the weekend despite being advised against it. Furthermore, talks between Israel and Hamas to reach a cease-fire have been interrupted.
Meanwhile, US government bond yields are retreating. After flirting with 2024 highs, the 10-year Treasury note offers 4.60%, down 5 basis points (bps), while the 2-year note is down 4 bps, now yielding 4.92%
XAU/USD short-term technical outlook
XAU/USD trades near $2,370, and the daily chart shows that the slide may continue. Technical indicators retreat from extreme overbought levels, suggesting the decline may continue. Still, a steeper slide remains out of the picture, as XAU/USD refuses to give up while developing its moving averages above all. The 20 Simple Moving Average (SMA) maintains its firmly bullish slope at around $2,281 and roughly $300 above an also bullish 100 SMA.
The 4-hour chart shows XAU/USD extending its slide below a mildly bearish 20 SMA, which is also supportive of a downward extension. The longer moving averages maintain their bullish slopes far below the current level, but technical indicators support the bearish case. The Relative Strength Index (RSI) indicator is extending its slide sub-50, while the Momentum indicator heads firmly south but still above its midline.
Support levels: 2,359.80 2,345.20 2,333.20
Resistance levels: 2,380.70 2,393.50 2,409.20
Author

Valeria Bednarik
FXStreet
Valeria Bednarik was born and lives in Buenos Aires, Argentina. Her passion for math and numbers pushed her into studying economics in her younger years.