Gold Price Forecast: XAU/USD continues rally amid trade uncertainty
- Gold prices halt a three-day positive streak, keeping the trade near $2,750.
- The US Dollar navigates without clear direction amid tariff uncertainty.
- Investors continue to wait for further details on Trump’s trade policies.

Gold (XAU/USD) fails to extend its weekly rally on Thursday, coming under some renewed selling pressure following three consecutive days of gains.
Indeed, the precious metal surged past $2,760 per troy ounce for the first time since early November on Wednesday, driven by persistent uncertainty surrounding announcements from United States (US) President Donald Trump, particularly his stance on tariffs.
However, the rally wasn’t without its hurdles. The US Dollar (USD) regained some of its strength, with the Dollar Index (DXY) bouncing off multi-week lows and reaching two-day highs near the key 108.00 milestone. This was in the context of further recovery in US yields across the board.
Despite the yellow metal’s retracement, President Trump's still unclear plans to impose tariffs on the European Union, Canada, Mexico, and Chinese imports appear to underpin the metal for the time being.
Gold’s balancing act amid trade and inflation concerns
Still around tariffs, Trump’s tariff-driven policies could complicate Gold’s outlook. While gold is traditionally viewed as a hedge against inflation, analysts warn that if tariffs fuel higher inflation, the Federal Reserve (Fed) might be forced to maintain elevated interest rates for a longer period. This could dampen the metal’s appeal, as the non-yielding asset tends to lose favour in a high-rate environment.
What’s next for Gold?
In the short term, market attention will remain focused on developments from the White House, especially given the lighter economic calendar this week. Investors are also gearing up for the FOMC January 28–29 meeting, where rates are expected to hold steady in the 4.25%–4.50% range.
As political uncertainty lingers and central bank decisions loom, gold’s position as a safe-haven asset could continue to attract attention.
Gold’s technical picture
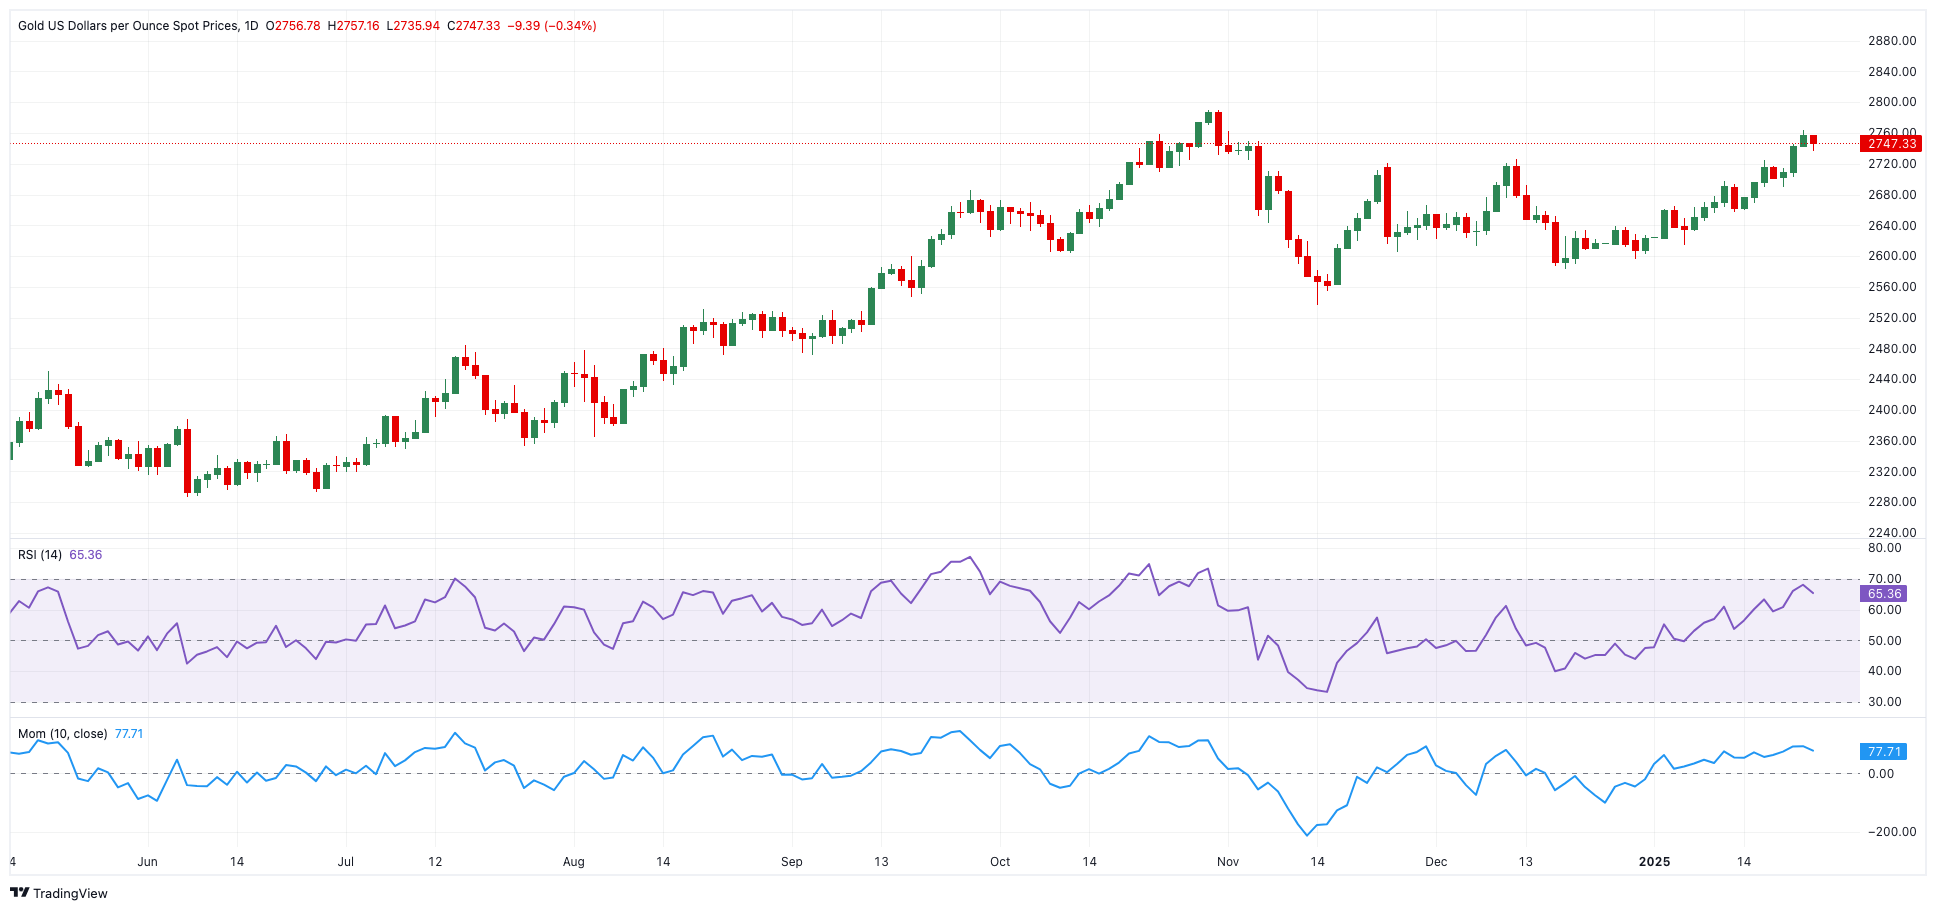
On the technical front, gold’s next major resistance level lies at $2,763, the 2025 high reached on January 22. A break above this level could see traders eyeing the all-time top of $2,790, recorded on October 31. Beyond these levels, Fibonacci extensions of the 2024 rally suggest potential targets at $3,009, $3,123, and $3,288.
On the downside, key support levels include December’s low of $2,582, November’s low of $2,536, and the 200-day moving average at $2,517. A deeper correction could test $2,471 (September low) ahead of $2,353 (July’s weekly low).
In the event of a more significant selloff, traders should watch for levels near $2,286 (June low) and $2,277 (May low). The ultimate downside target for now stands at $1,984, the lowest level hit in 2024.
Gold daily chart
Premium
You have reached your limit of 3 free articles for this month.
Start your subscription and get access to all our original articles.
Author

Pablo Piovano
FXStreet
Born and bred in Argentina, Pablo has been carrying on with his passion for FX markets and trading since his first college years.


