Gold Price Forecast: XAU/USD buyers pause but refuse to give up yet
- Gold price pauses early Thursday after reaching a three-month top on Wednesday at $2,763.
- Trump’s tariffs uncertainty offset China’s optimism, leaving Gold price and the US Dollar sidelined.
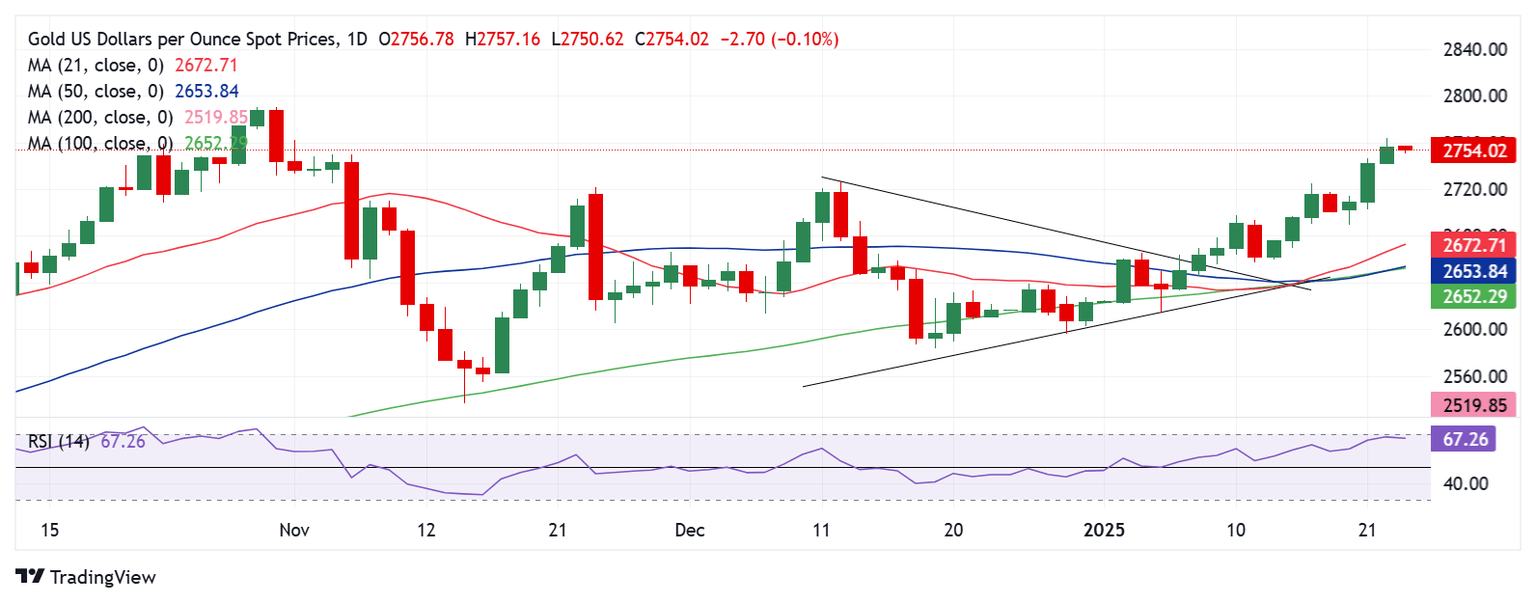
- Technically, Gold price stays bullish, with eyes on the symmetrical triangle target at $2,785 or record highs.

Gold price consolidates its three-day bullish momentum early Thursday, having reached three-month highs of $2,763 on Wednesday. Gold buyers take a breather as attention turns toward US fundamentals, with the weekly Jobless Claims on tap.
Gold price pauses before the next push higher
Gold traders digest the latest developments surrounding US President Donald Trump’s recent tariff plans, which offset the emerging optimism from China due to additional supportive measures from local authorities.
Trump’s plan to impose 25% tariffs on Mexico and Canada and 10% tariffs on China is expected to face opposition from many of his fellow Republicans in Congress as the 47th US President is planning to explicitly use revenue from higher tariffs on imported goods to help pay for government programs and cover promised tax cuts.
Trump’s tariffs uncertainty likely diminishes the haven demand for the US Dollar (USD), Gold price and US government bonds, in turn boding well for the US Treasury bond yields.
However, the Gold price retreat remains capped by the renewed optimism induced by the China Securities Regulatory Commission’s (CSRC) new supportive measures to prop up Chinese equity markets. China is the world’s top Gold consumer.
Gold traders now brace for a set of top-tier US economic data releases due Thursday to provide fresh clues on this year's US Federal Reserve (Fed) interest rate-cut outlook. Friday’s S&P Global US preliminary PMI data will help offer insights into the state of the economy. Markets are pricing in a total easing of 37 basis points (bps) from the Fed this year, with the first-rate cut not fully priced until July, per LSEG data.
Weak US data will double down on expectations of two Fed rate cuts this year, which were revived after the tame inflation reports for December published last week.
It’s worth noting that US President Trump’s tariff talks will continue to drive risk sentiment, the US Dollar and the Gold price action as the US statistics might play second fiddle.
Gold price technical analysis: Daily chart
Gold price maintains its bullish potential from a short-term perspective and remains poised to test the record high of $2,790 or the symmetrical triangle target, measured at $2,785.
Gold price charted a symmetrical triangle breakout earlier this month while it holds comfortably above all the major daily simple moving averages (SMA), supporting the bullish case.
The 14-day Relative Strength Index (RSI) sits beneath the overbought region, currently near 67, supporting the case for more upside.
Gold price must seek a daily closing above the November 2024 high of $2,762 to take on the next target near the aforementioned resistance near $2,790.
Conversely, Gold price could test the previous day’s low of $2,742 if the pullback gathers strength.
Sellers will then aim for the $2,700 round level, below which the 21-day SMA at $2,673 will be threatened.
Economic Indicator
Initial Jobless Claims
The Initial Jobless Claims released by the US Department of Labor is a measure of the number of people filing first-time claims for state unemployment insurance. A larger-than-expected number indicates weakness in the US labor market, reflects negatively on the US economy, and is negative for the US Dollar (USD). On the other hand, a decreasing number should be taken as bullish for the USD.
Read more.Next release: Thu Jan 23, 2025 13:30
Frequency: Weekly
Consensus: 220K
Previous: 217K
Source: US Department of Labor
Every Thursday, the US Department of Labor publishes the number of previous week’s initial claims for unemployment benefits in the US. Since this reading could be highly volatile, investors may pay closer attention to the four-week average. A downtrend is seen as a sign of an improving labour market and could have a positive impact on the USD’s performance against its rivals and vice versa.
Premium
You have reached your limit of 3 free articles for this month.
Start your subscription and get access to all our original articles.
Author

Dhwani Mehta
FXStreet
Residing in Mumbai (India), Dhwani is a Senior Analyst and Manager of the Asian session at FXStreet. She has over 10 years of experience in analyzing and covering the global financial markets, with specialization in Forex and commodities markets.


