XAU/USD Current price: $2,496.69

  • Weaker-than-anticipated United States employment data boosted the mood.
  • The US Treasury yield curve turned flat, signalling decreased recession fears.
  • XAU/USD bounced from a fresh weekly low, bears still have a chance.

Spot Gold trades just below the $2,500 level, recovering from a fresh weekly low of $2,472.40 posted during London trading hours. XAU/USD remained on the back foot throughout the first half of the day but changed course with the release of United States (US) data.

The number of job openings on the last business day of July stood at 7.67 million,  according to the JOLTS Job Openings report released by the US Bureau of Labor Statistics (BLS). The reading was well below the 8.1 million expected, putting pressure on the US Dollar. The figures, showing a weaker labor market, fueled speculation that the Federal Reserve (Fed) is now more likely to trim interest rates by 50 basis points (bps) when it meets in a couple of weeks.

 Enthusiasm about lower borrowing costs also helped equities. Wall Street shrugged off the negative note of its overseas counterparts and posts modest gains mid-session, further weighing on the American currency.

The report was the first of a series that will end on Friday with the Nonfarm Payrolls (NFP) report. On Thursday, the focus will be on the ADP Employment Change figure, which indicates new job positions added on a monthly basis by the private sector. Market participants anticipate it would hit 145K in August after printing at 122K in July.

In the meantime, the US Treasury yield curve has turned flat. Both the 10-year note and the 2-year note are yielding roughly 3.79%. Generally speaking, the longer-term bond tends to offer a higher return. The inverted scenario, which has been in place for a couple of years now, is usually seen as a sign of an upcoming recession.  Sure enough, a return to normal in the yield curve should back a firmer recovery among high-yielding assets and limit Gold gains.

XAU/USD short-term technical outlook  

The daily chart for XAU/USD suggests that buyers are adding on dips. The pair fell below a bullish 20 Simple Moving Average (SMA) but quickly recovered above it for a second consecutive day. At the same time, technical indicators have lost their downward slope and are currently consolidating within positive levels. Finally, the 100 and 200 SMAs maintain their upward slopes far below the shorter one, reflecting sustained aims to push it higher.

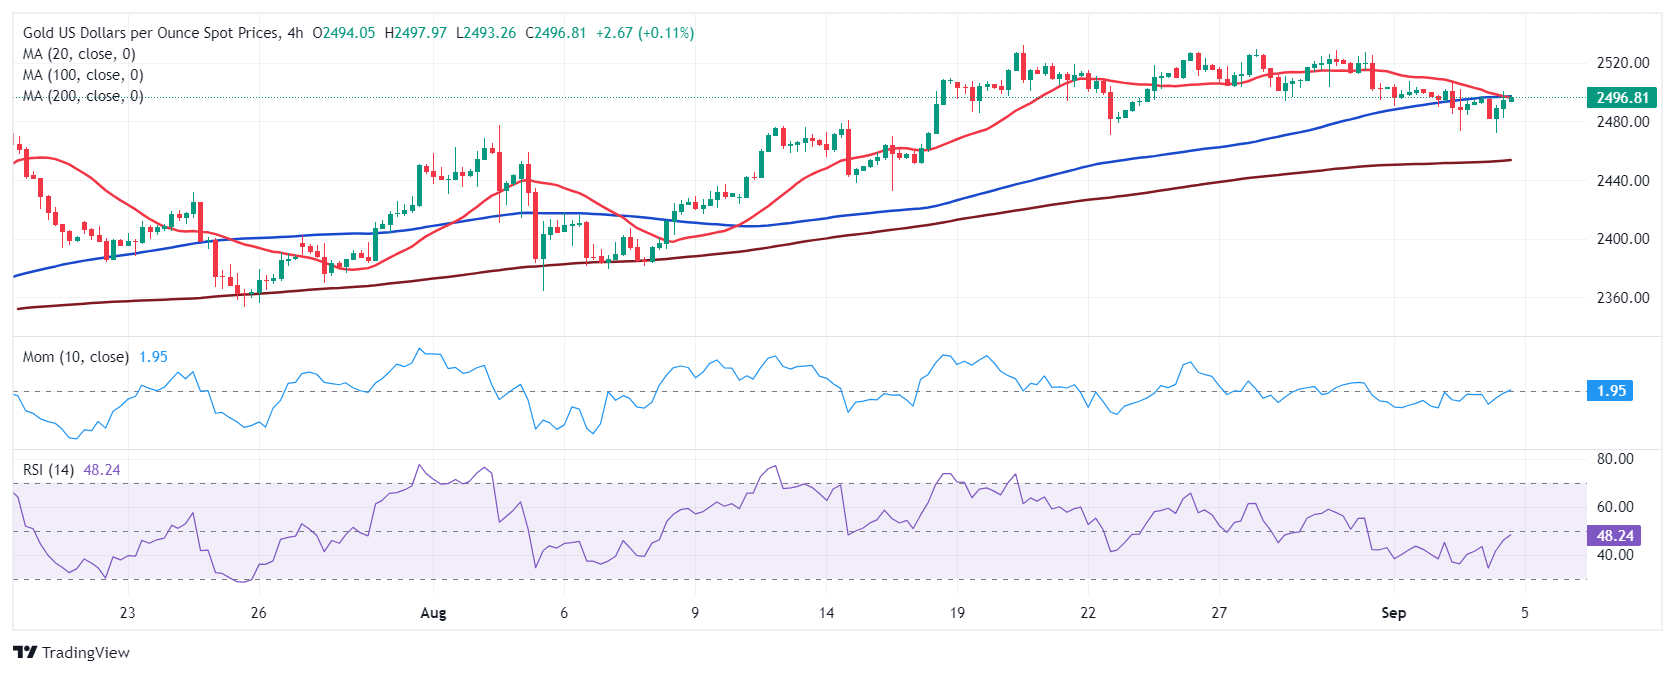
In the near term, and according to the 4-hour chart, XAU/USD is neutral. The price converges with the 20 and 100 SMAs, with the shorter one about to cross below the longer one, usually a sign of an upcoming slide. At the same time, technical indicators recovered from their intraday lows and turned flat at around their midlines. Should the pair fail to reconquer the $2,500 mark, there is a chance the aforementioned low gets retested in the near term.

Support levels: 2,489.60, 2,475.70 2,463.40  

Resistance levels: 2,507.40 2,519.75 2,531.60

Information on these pages contains forward-looking statements that involve risks and uncertainties. Markets and instruments profiled on this page are for informational purposes only and should not in any way come across as a recommendation to buy or sell in these assets. You should do your own thorough research before making any investment decisions. FXStreet does not in any way guarantee that this information is free from mistakes, errors, or material misstatements. It also does not guarantee that this information is of a timely nature. Investing in Open Markets involves a great deal of risk, including the loss of all or a portion of your investment, as well as emotional distress. All risks, losses and costs associated with investing, including total loss of principal, are your responsibility. The views and opinions expressed in this article are those of the authors and do not necessarily reflect the official policy or position of FXStreet nor its advertisers. The author will not be held responsible for information that is found at the end of links posted on this page.

If not otherwise explicitly mentioned in the body of the article, at the time of writing, the author has no position in any stock mentioned in this article and no business relationship with any company mentioned. The author has not received compensation for writing this article, other than from FXStreet.

FXStreet and the author do not provide personalized recommendations. The author makes no representations as to the accuracy, completeness, or suitability of this information. FXStreet and the author will not be liable for any errors, omissions or any losses, injuries or damages arising from this information and its display or use. Errors and omissions excepted.

The author and FXStreet are not registered investment advisors and nothing in this article is intended to be investment advice.

Recommended Content


Recommended Content

Editors’ Picks

GBP/USD rises toward 1.3450 after strong UK inflation data

GBP/USD rises toward 1.3450 after strong UK inflation data

GBP/USD gains traction and climbs toward 1.3450 in the European morning on Wednesday. The data from the UK showed that the annual CPI inflation jumped to 3.5% in April from 2.6% in March, surpassing the market expectation of 3.3% and boosting Pound Sterling.

EUR/USD advances further toward 1.1350 on intense US Dollar weakness

EUR/USD advances further toward 1.1350 on intense US Dollar weakness

EUR/USD is holding firm, eyeing 1.1350 early Wednesday on the back of a sharp sell-off in the US Dollar. Renewed trade jitters, along with fresh concerns about the US fiscal health, add further pressure on the Greenback. The focus now is on the ECB and Fed-speak. 

Gold price awaits acceptance above $3,300 as buyers return

Gold price awaits acceptance above $3,300 as buyers return

Gold price is extending its upswing into the third consecutive day in Asian trading on Wednesday. Buyers look to regain the $3,300 on a sustained basis amid persistent US Dollar weakness and heightened geopolitical tensions.

Dogecoin and Shiba Inu Price Forecast: DOGE and SHIB show early signs of a bullish breakout

Dogecoin and Shiba Inu Price Forecast: DOGE and SHIB show early signs of a bullish breakout

Dogecoin (DOGE) and Shiba Inu (SHIB) show early signs of a potential rally as both meme coins stabilize at key support levels. On-chain metrics for dog-themed meme coins show positive funding rates and dormant activity, reinforcing bullish sentiment. The technical outlook also supports the case for double-digit gains.

China April slowdown shows the impact of economic uncertainty

China April slowdown shows the impact of economic uncertainty

Trade war uncertainty is denting Chinese confidence, resulting in slower economic activity in April. Retail sales and fixed-asset investment both underperformed forecasts amid heightened caution. Yet the impact on manufacturing was less than feared.

The Best brokers to trade EUR/USD

The Best brokers to trade EUR/USD

SPONSORED Discover the top brokers for trading EUR/USD in 2025. Our list features brokers with competitive spreads, fast execution, and powerful platforms. Whether you're a beginner or an expert, find the right partner to navigate the dynamic Forex market.

Majors

Cryptocurrencies

Signatures

Best Brokers of 2025