Gold Price Forecast: US stimulus optimism, Delta fears to boost XAU/USD’s recovery
- Gold price consolidates, awaiting next push higher.
- US dollar holds steady amid a rebound in Treasury yields.
- US stimulus news lifts gold, technicals favor bullish traders.

As the US dollar’s demand dominated at the start of a fresh week on rising concerns over the Delta covid strain and its impact on global economic recovery, gold price lost considerable ground in the first half of Monday’s trading. Gold price tumbled to five-day lows of $1795, although staged a solid comeback in the American session to finish the day marginally higher at $1813.
The rebound in gold price was triggered by fears over runaway inflation, as US President Joe Bien pushed for more spending to support the economy. The US Treasury yields rebounded firmly from five-month lows of 1.176% amid the renewed optimism over infrastructure bill after Senate Majority Leader Chuck Schumer said, “Procedural vote on infrastructure bill will take place on Wednesday,” offering the much-needed breather to the markets. However, the sell-off in the global stocks offset the rebound in the Treasury yields, boding well for gold price.
On Tuesday, gold price has paused its recovery near $1820, $5 short of the 200-Daily Moving Average (DMA), as the bulls catch a breather amid the recent rebound in the US rates and an uptick in the S&P 500 futures. The US dollar holds steadier against its main peers amid mixed market sentiment and looming covid concerns. In the day ahead, the focus will remain on the risk trends and dynamics in the greenback and the yields for near-tern trading opportunities. The second-tier US housing data could throw some fresh light on the economy and the Fed’s next policy moves.
Gold Price Chart - Technical outlook
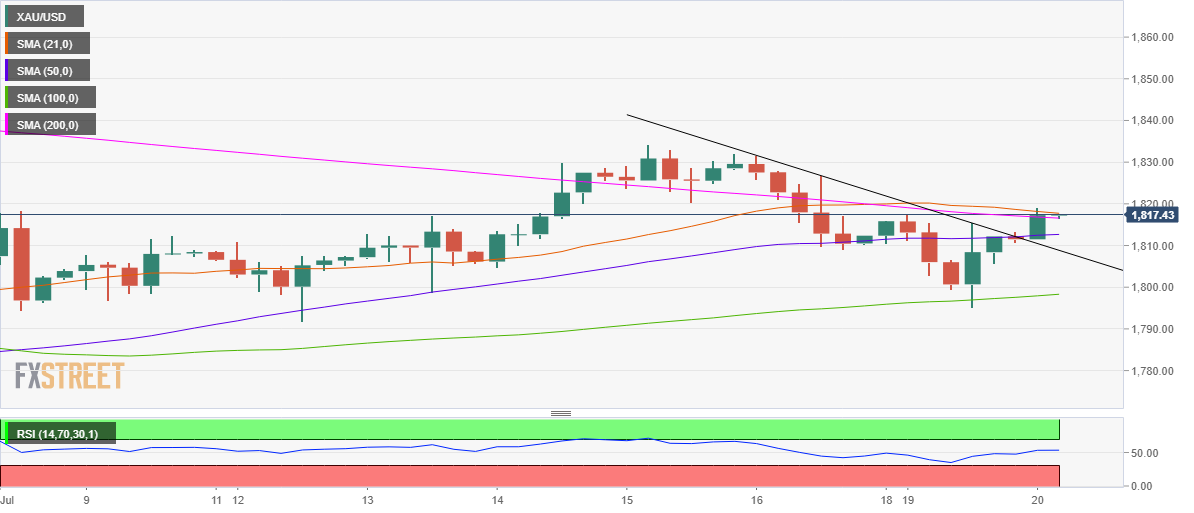
Gold: Four-hour chart
Gold’s four-hour chart shows that the price is battling the critical resistance at $1818 on its recovery mode. That level coincides with the confluence of the 21-Simple Moving Average (SMA) and 50-SMA.
Monday’s surge led to an upside breakout of the downward-sloping trendline resistance at $1812, in the wake of a four-hourly candlestick closing above that barrier.
Acceptance above $1818 could trigger a fresh advance towards the 200-DMA at $1825. Further up, the three-week highs of $1834 could be back in play.
The Relative Strength Index (RSI) is holding firmer above the midline, supporting a case for additional upside.
On the downside, an immediate cap is seen at the horizontal 50-SMA at $1812, below which the descending trendline resistance now support, now at $1808 will get tested.
A sustained break below that level could expose the mildly bullish 100-SMA at $1798.
Premium
You have reached your limit of 3 free articles for this month.
Start your subscription and get access to all our original articles.
Author

Dhwani Mehta
FXStreet
Residing in Mumbai (India), Dhwani is a Senior Analyst and Manager of the Asian session at FXStreet. She has over 10 years of experience in analyzing and covering the global financial markets, with specialization in Forex and commodities markets.


