Gold Price Forecast: Shallow XAU/USD rebound fails to convince bulls
- XAU/USD stays in a consolidation phase on Wednesday.
- USD starts to gather strength as 10-year US T-bond yield turns north.
- Near-term technical outlook remains neutral with a bearish bias.

The XAU/USD pair closed the previous two trading days in the negative territory and lost nearly 1% during that time span. After staging a technical correction and rising to $1,735 on Wednesday, however, the pair seems to be having a difficult time gathering momentum. As of writing, XAU/USD was up only 0.15% on the day at $1,729.
The Treasury bond yields started the week on the back foot and registered big losses before reversing direction on Wednesday. With the benchmark 10-year US T-bond yield gaining 1% on Wednesday, the greenback started tp find demand and limited XAU/USD's upside. Reflecting the broad-based USD strength, the US Dollar Index is currently trading at its highest level since November at 92.57, rising 0.25% on a daily basis.
Earlier in the day, the data published by the US Census Bureau revealed that Durable Goods Orders in February declined by 1.1%, missing the market expectation for an increase of 0.8%. On a positive note, the IHS Markit's preliminary PMI report revealed that the economic activity in the US private sector continued to expand at a robust pace in March with the Composite PMI arriving at 59.1.
There won't be any other macroeconomic data releases from the US in the remainder of the day and the greenback's market valuation is likely to continue to impact XAU/USD's movements. On Thursday, the US Bureau of Economic Analysis will release its final estimate of the fourth-quarter Gross Domestic Product (GDP), which is expected to show that the economy grew by 4.1%.
Gold technical outlook
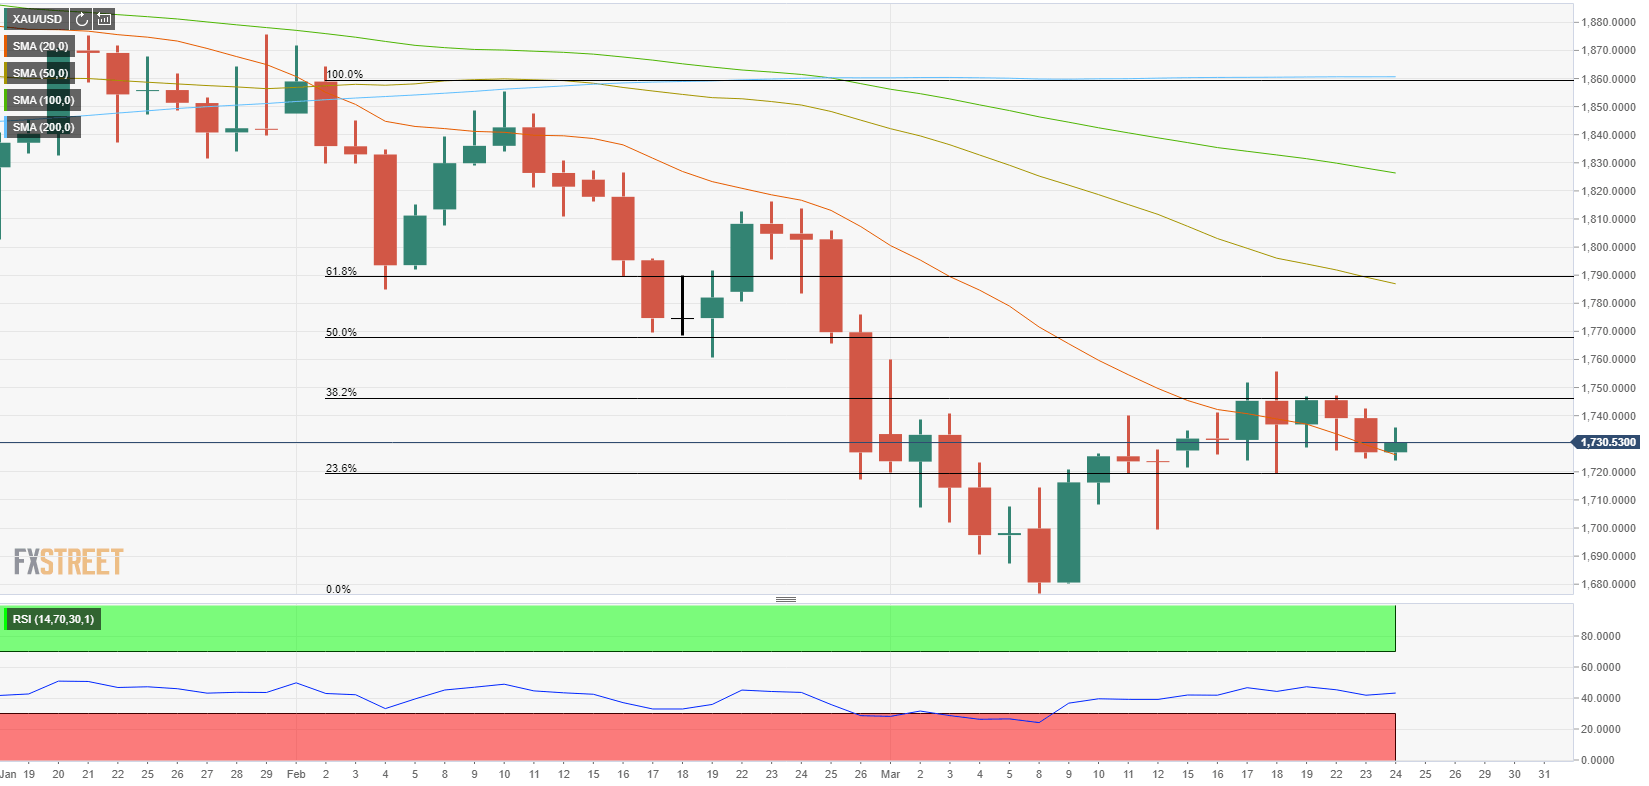
The technical picture on the daily chart points to a neutral stance with a bearish bias as the Relative Strength Index (RSI) indicator extends its sideways grind below 50. Furthermore, key technical levels, that could trigger a sharp market reaction if broken, remain intact for the tenth straight trading day.
On the upside, a daily close above $1,745 (Fibonacci 38.2% retracement of the Feb. 2-Mar. 8 drop) could attract more buyers and open the door for additional gains toward $1,755 (March 18 high) and $1,7667 (Fibonacci 50% retracement).
The 20-day SMA is acting as interim support at $1,725 ahead of the critical $1,720 (Fibonacci 23.6% retracement) mark. Below that level, additional losses toward $1,700 (psychological level, March 12 low) could be witnessed.
Premium
You have reached your limit of 3 free articles for this month.
Start your subscription and get access to all our original articles.
Author

Eren Sengezer
FXStreet
As an economist at heart, Eren Sengezer specializes in the assessment of the short-term and long-term impacts of macroeconomic data, central bank policies and political developments on financial assets.


