Gold Price Forecast: Defending $2,318 support is critical for XAU/USD
- Gold price remains defensive but holds $2,300 early Wednesday.
- US Dollar decline offers comfort to Gold price amid ebbing Middle East tensions.
- Gold price downside appears limited so long as the 21-day SMA holds, as the RSI stays bullish.

Gold price is nursing losses while holding above $2,300 early Wednesday, stalling its two-day decline, as traders look forward to the mid-tier US economic data for fresh cues on the US Federal Reserve (Fed) interest rates outlook.
Gold price, US Dollar struggles amid risk rally
Despite the extended pullback in the US Dollar and the US Treasury bond yields on Tuesday, Gold price built on its corrective downside, as ebbing fears over a wider regional conflict in the Middle East dented the safe-haven appeal of Gold price.
Additionally, risk-rally on Wall Street indices, in anticipation of corporate earnings results from key US tech giants, also weighed on the traditional safety bet, Gold price. Even though the US Dollar wilted amid risk flows, the bright metal failed to capitalize and hit fresh two-week lows just below $2,300.
The US Dollar also bore the brunt of the upsurge in the Euro, fuelling by surprisingly robust European business activity data.
But the continued weakness in the US Treasury bond yields did lend some support to non-yielding Gold price, as the focus shifts toward the US fundamental news and the Fed rate cut expectations, with the Middle East geopolitical tensions taking a back seat.
So far this Wednesday, Gold pirce defends key technical support, as the US Dollar licks its wounds but a modest uptick in the US Treasury bond yields keeps Gold sellers hopeful. The risk-on market mood also remains a weight on both Gold price and the US Dollar. Asian traders react positively to Tesla Inc.’s results published after the US markets close.
Tesla’s stock price rose over 13% in post-market trading to $163.96 after billionaire founder, Elon Musk, highlighted that the production of the new, affordable EV models could be preponed. Traders shrugged off Tesla’s 9% YoY decline in its revenue for the March quarter.
All eyes now remain on the mid-tier US Durable Goods data due later on Wednesday for fresh trading incentives, as the main event risk this week remains the advance first-quarter US Gross Domestic Product (GDP) release, especially after Tuesday’s downbeat US Preliminary Composite PMI.
S&P Global said on Tuesday that its preliminary US Composite PMI Output Index, which tracks the manufacturing and services sectors, fell to 50.9 this month from 52.1 in March. Both Manufacturing and Services PMI fell short of market expectations in April, raising doubts over the US economic resilience. Therefore, the US GDP report will be closely scrutinized for any alterations to the market’s pricing of the Fed rate cut expectations this year.
Markets price in the first Fed rate cut in September, according to the CME Group’s FedWatch Tool. Meanwhile, the total easing expected this year would just be 40 basis points (bps), a sea change from about 150 basis points of cuts priced in at the beginning of the year, per Reuters.
Gold price technical analysis: Daily chart
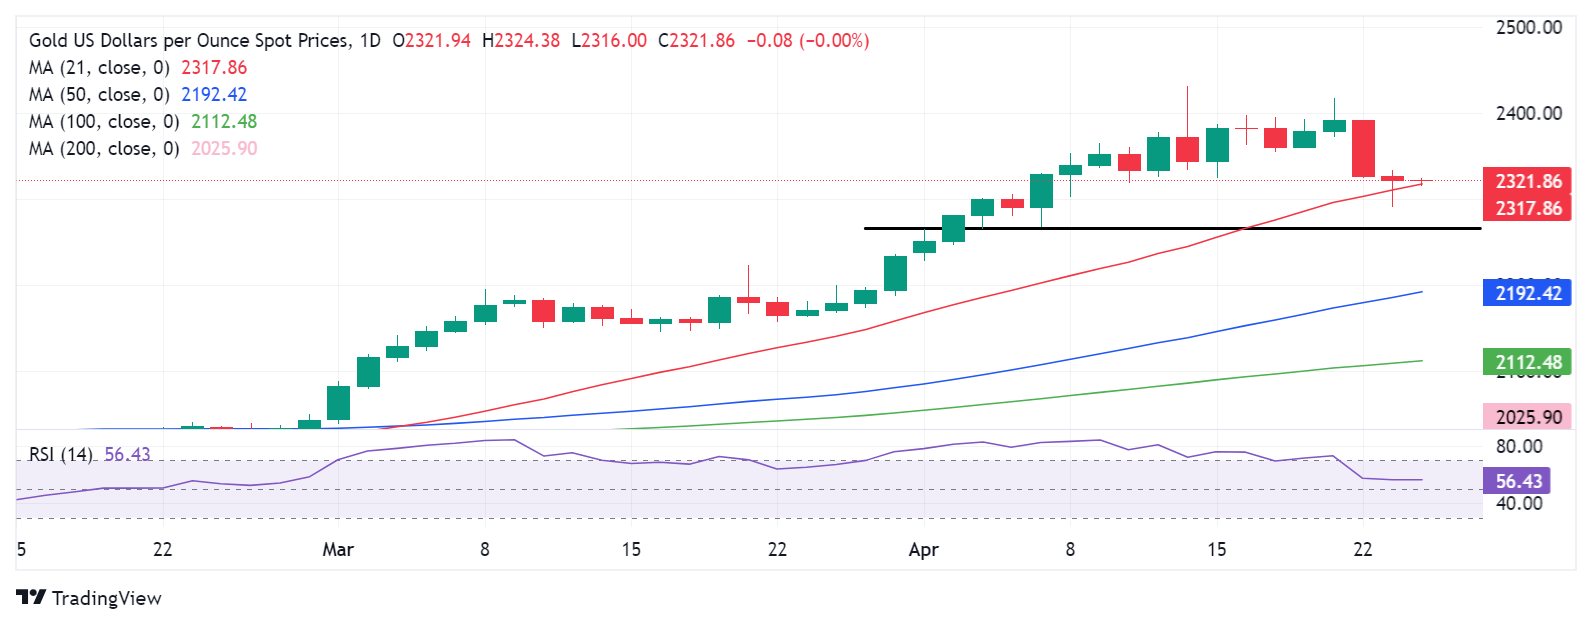
As observed on the daily chart, Gold price is flirting with the key 21-day Simple Moving Average (SMA) at $2,318, having managed to close Tuesday above it.
The 14-day Relative Strength Index (RSI), a leading indicator, has turned flat while above the midline, near 56.50. This suggests that a rebound remains in the offing if the 21-day SMA holds fort.
The first point of resistance is seen at the previous day’s high of $2,334, above which the $2,350 psychological level will be tested.
Further up, Gold buyers will target the static resistance near $2,360-$2,365.
Should Gold sellers regain poise, the next key demand area is seen at the previous day’s low of $2,291 on a sustained move below the 21-day SMA support.
The last line of defense for Gold buyers could be the early April low near $2,265.
Gold FAQs
Gold has played a key role in human’s history as it has been widely used as a store of value and medium of exchange. Currently, apart from its shine and usage for jewelry, the precious metal is widely seen as a safe-haven asset, meaning that it is considered a good investment during turbulent times. Gold is also widely seen as a hedge against inflation and against depreciating currencies as it doesn’t rely on any specific issuer or government.
Central banks are the biggest Gold holders. In their aim to support their currencies in turbulent times, central banks tend to diversify their reserves and buy Gold to improve the perceived strength of the economy and the currency. High Gold reserves can be a source of trust for a country’s solvency. Central banks added 1,136 tonnes of Gold worth around $70 billion to their reserves in 2022, according to data from the World Gold Council. This is the highest yearly purchase since records began. Central banks from emerging economies such as China, India and Turkey are quickly increasing their Gold reserves.
Gold has an inverse correlation with the US Dollar and US Treasuries, which are both major reserve and safe-haven assets. When the Dollar depreciates, Gold tends to rise, enabling investors and central banks to diversify their assets in turbulent times. Gold is also inversely correlated with risk assets. A rally in the stock market tends to weaken Gold price, while sell-offs in riskier markets tend to favor the precious metal.
The price can move due to a wide range of factors. Geopolitical instability or fears of a deep recession can quickly make Gold price escalate due to its safe-haven status. As a yield-less asset, Gold tends to rise with lower interest rates, while higher cost of money usually weighs down on the yellow metal. Still, most moves depend on how the US Dollar (USD) behaves as the asset is priced in dollars (XAU/USD). A strong Dollar tends to keep the price of Gold controlled, whereas a weaker Dollar is likely to push Gold prices up.
Author

Dhwani Mehta
FXStreet
Residing in Mumbai (India), Dhwani is a Senior Analyst and Manager of the Asian session at FXStreet. She has over 10 years of experience in analyzing and covering the global financial markets, with specialization in Forex and commodities markets.