Gold's technical picture remains bullish amid mixed economic indicators

This week's financial landscape has been significantly influenced by a surprising pullback in the US Dollar (USD), particularly following the US Non-Farm Payrolls (NFP), which fell short of expectations for April. The USD retreated to mid-104.00s, marking a three-week low. This decline in the dollar has set the stage for renewed discussions about the Federal Reserve's monetary policy, mainly focusing on a potential easing in September.
Market sentiments have fluctuated sharply with the evolving economic indicators, notably the resilient US inflation data in recent Consumer Price Index (CPI) and Personal Consumption Expenditures (PCE) reports. These figures suggest that inflationary pressures, although slightly decelerated, remain strong, backed by a tight labor market. This scenario supports the possibility that the Federal Reserve might sustain its tight monetary policies longer than some investors expected. Fed Chairman Jerome Powell underscored the necessity for clear evidence of inflation moving towards the 2% target before considering rate cuts.
The technical outlook for Gold
In light of these economic dynamics, the technical analysis for gold presents a compelling bullish case. The monthly chart below presents the strong bullish patterns seen by the inverted head and shoulders formation with the head positioned in 2015 and the shoulders tracing back to fluctuations between 2011-2012 and 2021-2023. This pattern reached a critical juncture in March 2024 when gold prices surged past the long-term resistance at $2,075, a level closely monitored by market analysts for years.
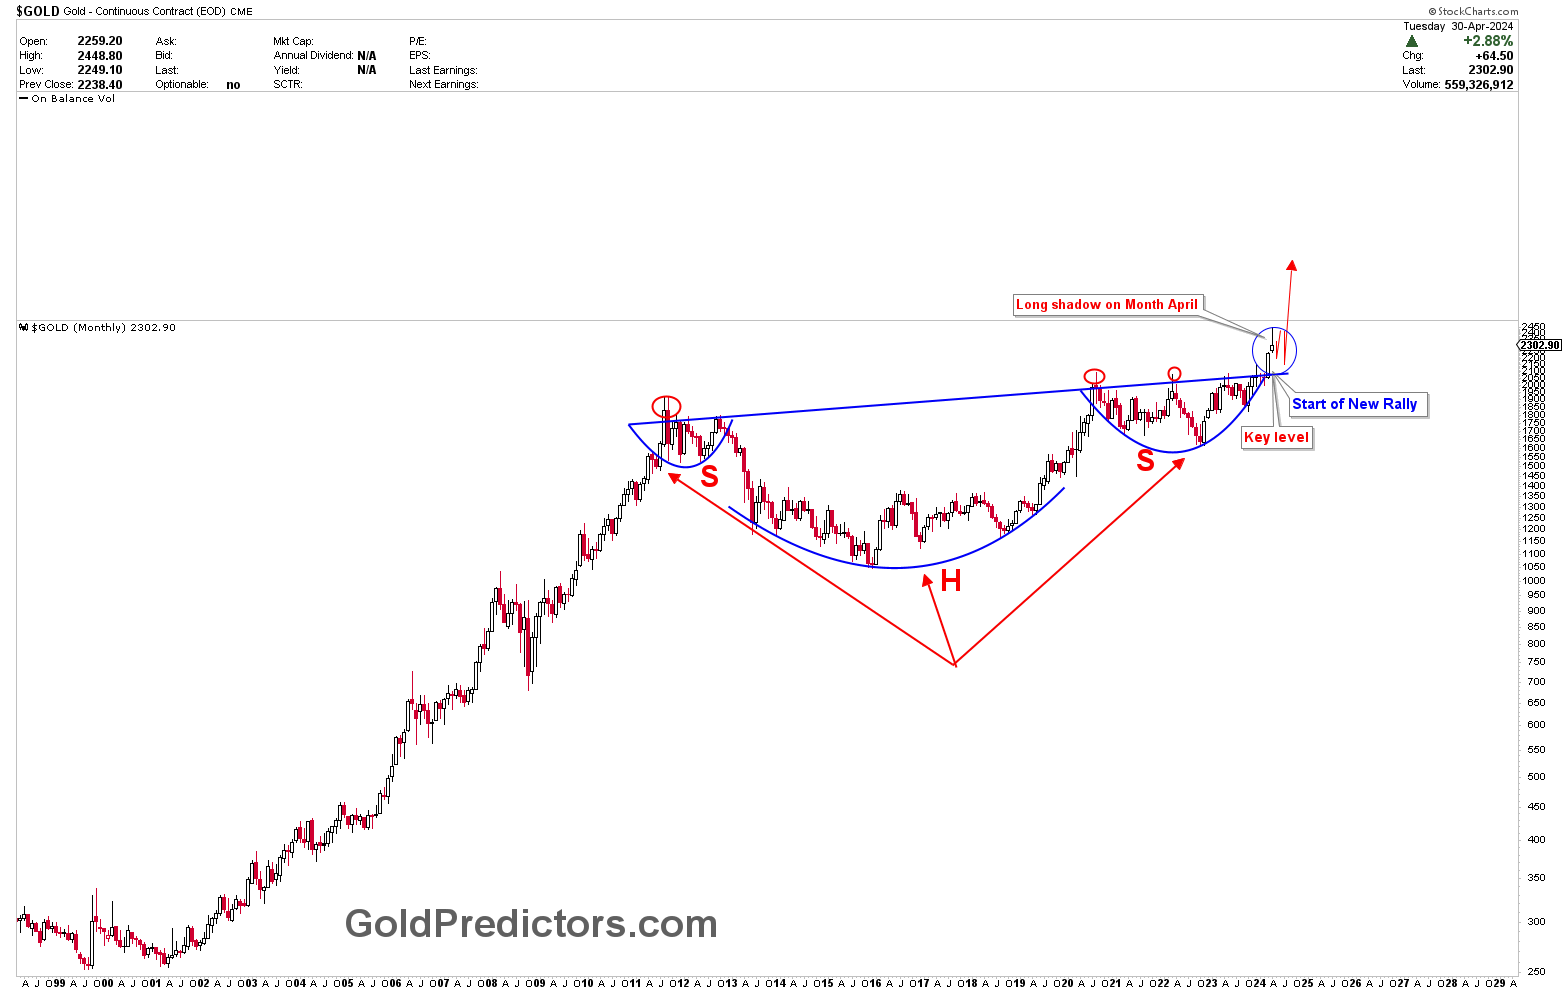
The breakout above this threshold signals a solid bullish momentum, potentially setting the stage for a significant rally in the coming years. Traditionally, gold prices might retrace to the breakout level after such a breakout, which now acts as support. However, given the long-term consolidation before the breakout, any corrections will likely be shallow, paving the way for sustained upward movements. The recent price actions in April, characterized by a strong wick, indicate a minor correction, yet the overall trend firmly points upwards. Currently, gold prices are consolidating within the apex of triangle pattern, suggesting an imminent breakout in the coming week. This breakout will indicate the next short-term direction for gold. However, any short-term correction is considered a long-term buy.
Conclusion
The intersection of shifting monetary policy expectations in the United States and solid technical indicators in the gold market creates a unique investment landscape. Gold remains a critical asset to watch as investors recalibrate their expectations based on the Federal Reserve's cues and broader economic indicators. The metal's price dynamics indicate a robust bullish trend underpinned by significant technical patterns and market sentiment. As the market continues to digest economic data and central bank communications, gold could play a pivotal role in investment strategies, particularly as a hedge against lingering inflationary pressures and currency fluctuations. Investors would closely monitor the evolving macroeconomic factors and their implications for precious metals.
Unlock exclusive gold and silver trading signals and updates that most investors don’t see. Join our free newsletter now!
Author

Muhammad Umair, PhD
Gold Predictors
Muhammad Umair is a financial markets analyst and investor who focuses on the forex and precious metals markets.


