Gold Price Forecast: Corrective decline may continue once below 1,841.40

XAU/USD Current price: $1,849.95
- Easing tensions in the Ukrainian border weighed on safe-haven assets, gold got smashed.
- The better market mood persists despite the latest comments from Russian President Putin.
- XAU/USD is in a corrective decline, could turn bearish on a break below a Fibonacci support level.
Spot gold turned sharply lower after hitting an intraday high of $1,879.48 a troy ounce, a level that was last seen in June 2021. Financial markets keep fluctuating at the rhythm of Russia-Ukraine headlines. Investors turned optimistic on headlines indicating that Russia would withdraw troops from the Ukrainian border after they completed military exercises.
Optimism returned to financial markets and persisted well into the American session, despite there being no signs of progress. President Vladimir Putin noted that he does not want a war in Europe, adding that the decision on a partial withdrawal of troops has been taken. However, he also said that a "genocide" taking place in Eastern Ukraine's Donbass region and that Western nations answers to his proposals were not "constructive."
Gold plunged to $1,843.77 a troy ounce as stocks recovered their poise and government bond yields resumed their advances. Demand for the greenback eased, but the dollar's losses were partially offset by stronger yields. At the time being, Wall Street is firmly up holding on to substantial intraday gains. The yield on the 10-year Treasury note recovered above the 2% threshold, peaking for the day at 2.05%.
Gold price short-term technical outlook
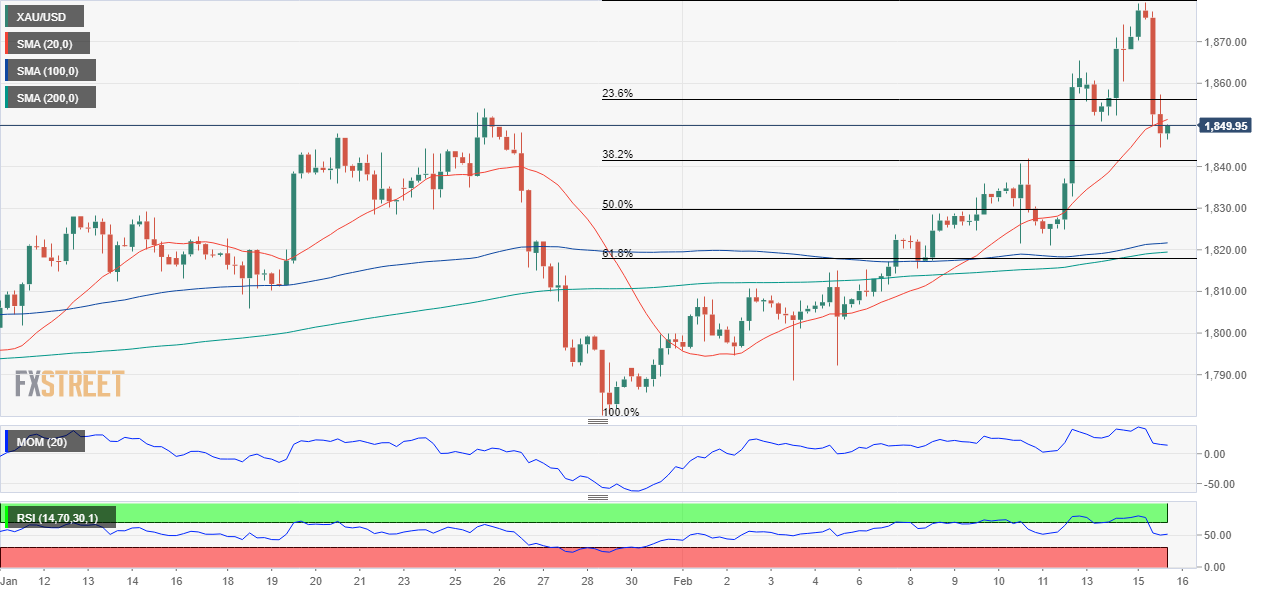
The XAU/USD pair trades around $1,852 a troy ounce, sharply down for the day but with limited bearish potential in the daily chart. Technical indicators hold within positive levels, although the RSI has already turned south. Meanwhile, moving averages remain far below the current level, with the 20 SMA maintaining its bullish slope above the longer ones.
The bright metal is so far holding above the 38.2% retracement of its latest bullish run at 1,841.40, the immediate support level. In the near term, and according to the 4-hour chart, the movement seems corrective. Gold is currently hovering around a bullish 20 SMA, while technical indicators corrected extreme overbought readings, now losing their bearish strength within positive levels.
Support levels: 1,841.40 1,829.70 1,817.90
Resistance levels: 1,858.00 1,866.65 1,879.50
Author

Valeria Bednarik
FXStreet
Valeria Bednarik was born and lives in Buenos Aires, Argentina. Her passion for math and numbers pushed her into studying economics in her younger years.


