A dovish cut, a hawkish message: How the Fed’s move sparked a Nasdaq repricing
The Fed cut — But with a caution label
At its December meeting, the Federal Reserve cut rates by 25 basis points to a target range of 3.50–3.75%, its first rate reduction in over two years. Policymakers cited moderate economic slowing, weaker job gains, and rising unemployment, while noting that inflation remains “somewhat elevated.”
The Fed also announced T-bill purchases to maintain “ample reserves” — a liquidity measure meant to support smooth market functioning.
However, Chair Jerome Powell’s tone was notably cautious. He emphasized that the Fed is not on a pre-set path for further cuts and that inflation is still above target. In essence, the central bank delivered a dovish action but wrapped it in hawkish messaging.
The hawkish cut: Limited relief ahead
While a rate cut typically signals easier policy, this one came with strings attached.
- The dot plot projects only one more cut through 2026.
- Two FOMC members dissented, preferring no cut at all.
- Powell stressed “patience” and data dependence.
This implies a shallow and uncertain easing cycle — a message that markets read as hawkish overall. It’s what strategists have dubbed:
A dovish cut wrapped in hawkish guidance.
The immediate result was a mixed market reaction:
- Front-end yields fell (2-year Treasury) on the cut.
- Long-end yields rose (10–30 year Treasuries) on the hawkish tone.
- The yield curve steepened, signaling tighter long-term financial conditions.
Split market reaction: S&P 500 vs. Nasdaq
That yield curve move explained the divergence in equity performance:
- The S&P 500 (SPX) — rich in cyclicals, banks, and industrials — rose +0.68%.
- The Nasdaq Composite — heavy on long-duration tech — fell –0.68%.
Cyclicals thrive when long yields rise and the curve steepens, while tech struggles in that environment.
This setup marked a rotation in market leadership — away from expensive growth and toward real-economy sectors.
Why the Nasdaq underperformed — Macro meets technicals
The Nasdaq’s weakness makes sense both fundamentally and technically.
Fundamentals:
- Tech = Long-Duration Asset – High valuations rely on low long-term rates.
- Hawkish Tone = Higher Long Yields – Compresses future cash flow valuations.
- Crowded AI and Semi Exposure – Investors trimming after overextended positioning.
- Limited Future Cuts – Restrains the multiple expansion that powered tech’s 2023 rally.
- Liquidity Support Helps Broader Risk, Not Growth-Specific Valuations.
“The cut helped sentiment, but the guidance forced a valuation rethink in growth.”
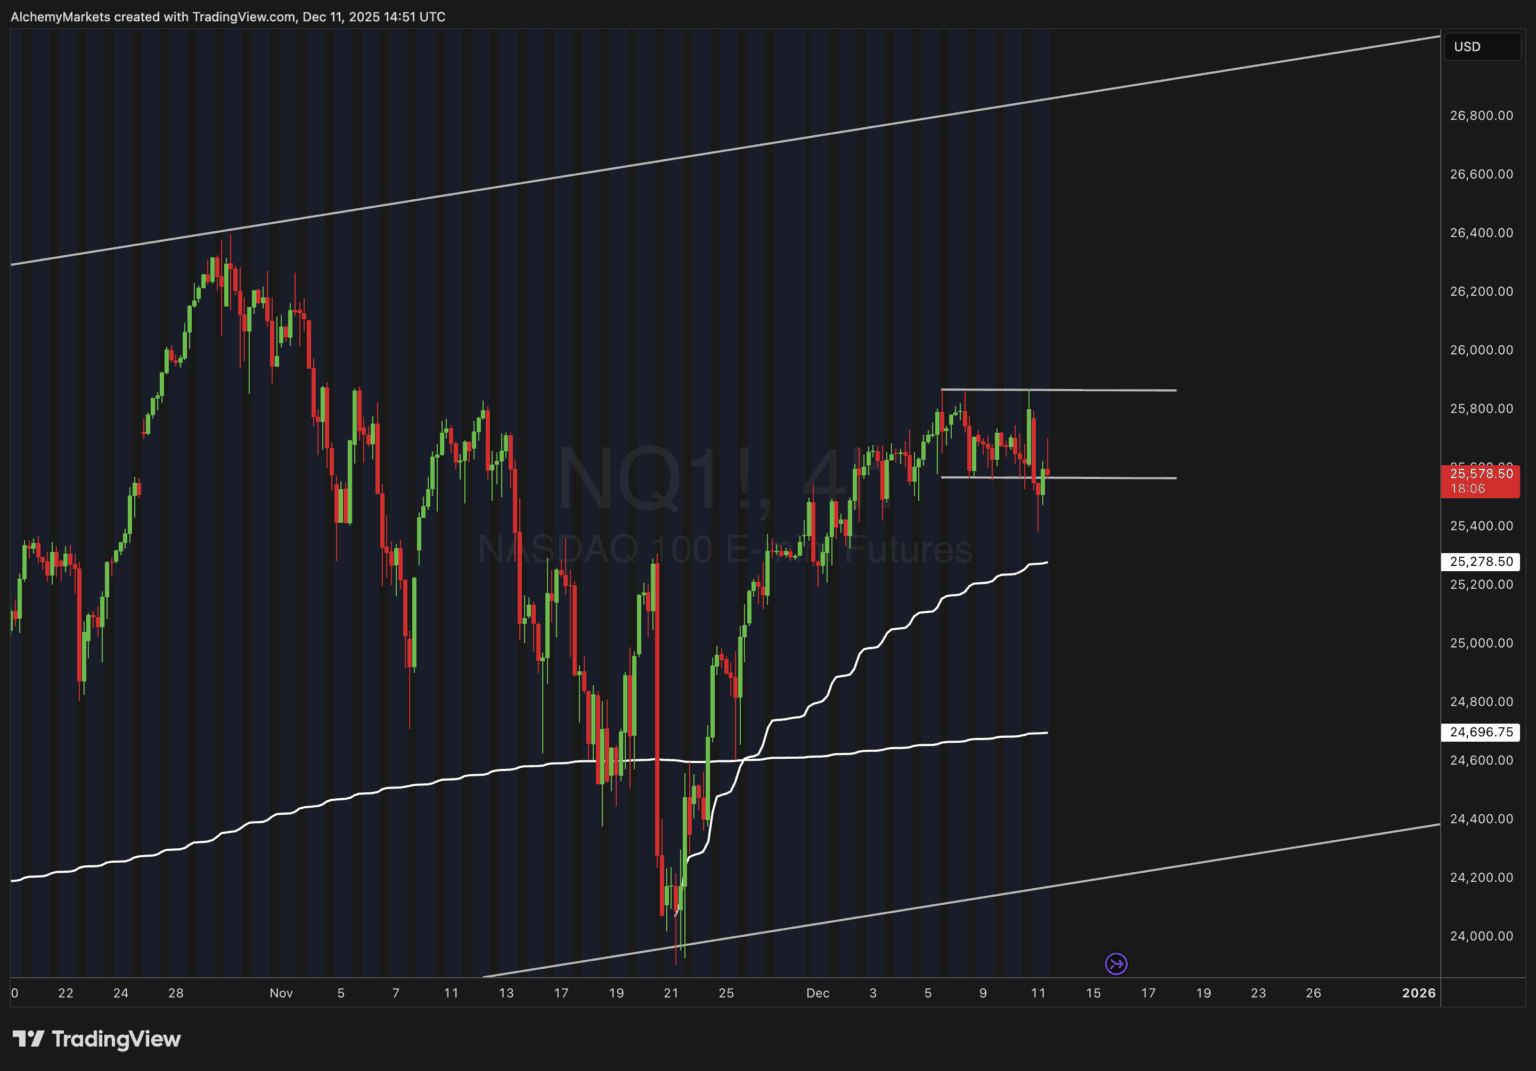
Technicals (Based on Current NQ1! Chart):
The Nasdaq 100 futures (NQ1!) currently trade around 25,600, sitting between short-term support near 25,400–25,450and resistance around 25,800–25,900.
- The lower white band (~25,277) represents the anchored VWAP from the November low — a key dynamic support level that has guided the rally.
- Price recently tested and bounced from this anchored VWAP, showing buyers are still defending the trend for now.
- However, a clean break below 25,250 would likely confirm a short-term correction, opening room toward 24,700–24,600, where the next major trendline support and prior consolidation base align.
- Conversely, if buyers can hold above VWAP and long-end yields stabilise, the Nasdaq could attempt one more push toward the upper channel near 25,900–26,000, which marks the top of its short-term trading range and potential resistance zone.
In short:
The Nasdaq is at a technical crossroads — either it starts a mild correction from here, or squeezes once more toward 26,000 before turning lower within its broader channel.
Could this trigger a tech correction?
The setup suggests that a near-term cooling in tech valuations is increasingly likely.
Why? Because the Nasdaq doesn’t respond to the rate cut itself, but to the path of future cuts. And right now, the Fed is signaling that policy will stay restrictive longer.
This environment — rising long yields and crowded positioning — could spark a controlled correction or sector rotation, not a crash. AI, semiconductors, and software names are most vulnerable, while cash-rich megacaps may act as stabilizers.
Expect volatility clusters and valuation compression as positioning resets into year-end.
Sector rotation: Flows tell the story
Institutional flows are already adjusting to this new regime:Rotation toward value and cyclicals is consistent with a hawkish-cut macro environment and a steepening yield curve.
Conclusion: Repricing, not panic
The December Fed meeting marked a subtle but meaningful shift.
The Fed cut rates, but its hawkish guidance reshaped equity leadership.
Markets are recalibrating around:
- A shallower easing cycle.
- Higher-for-longer long yields.
- Rotation from tech to cyclicals.
The Nasdaq 100 remains the most sensitive barometer of this change. Technically, it’s hovering at a decision point — either confirming a mild correction or staging a final test of resistance near 26,000 before a likely fade.
Either way, the message is the same:
This isn’t a liquidity-fueled bull phase — it’s a selective rotation phase.
Author

Zorrays Junaid
Alchemy Markets
Zorrays Junaid has extensive combined experience in the financial markets as a portfolio manager and trading coach. More recently, he is an Analyst with Alchemy Markets, and has contributed to DailyFX and Elliott Wave Forecast in the past.


