Comparing asset classes

We’ve got today’s issue and one more to go (tomorrow), so let’s compare a couple asset classes to one another and see where the market momentum is flowing.
First up, large cap stocks vs. small cap stocks…
For those who are new to a relative strength (relative comparison) chart that pins one investment against another, what you’re looking at below is NOT a chart of the S&P500 or the IWM. It’s a snapshot of the historical battle between the two.
Whichever ticker is in the numerator (the one you type first) is the one that’s winning if the chart is trending up… and the ticker that’s typed second (i.e., the denominator) is winning if the chart is trending down. I add a 150-day moving average to all my RS charts, just to have a line-in-the-sand below (or above) which to determine which investment is in the lead.
You can actually execute one of these on your own, for free, at StockCharts.com. Just take the first symbol, add a colon, and then type the second symbol, and what will pop up is the RS chart. (Nerd’s Note: You’ll want to change it to a line chart if it pops up as a bar or candlestick chart, then turn off the volume indicator, and add a 150MA to make it look like this one, but hopefully that helps).
But anyway, back to the chart – and what we see here is, since COVID, there have been a few short periods of small cap outperformance over the S&P500, but nothing sustainable.
Today, however, I’m seeing a lower top in the RS chart below, so a short-term downtrend, combined with a second drop below the 150MA… and if you combine this relative action with the absolute price action of small caps, this is looking like a good entry point .
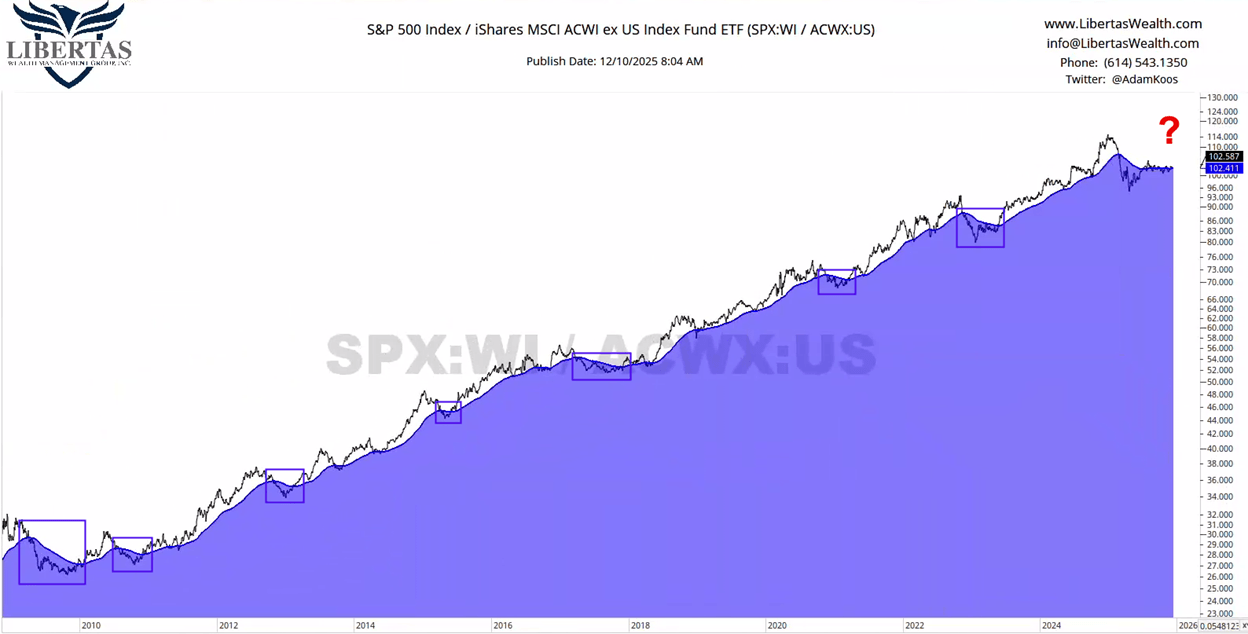
Next is a longer, zoomed-out chart of the battle between U.S. and international stocks. I purposely zoomed out to 2009 because I wanted to make it clear that the U.S. has generally been the best place for our hard-earned retirement savings for a long… long time.
Again, you can see intermittent periods of underperformance in the S&P500 vs. the All-Country World Index (ex-US), but those time periods when international stocks were winning were… well, short-lived.
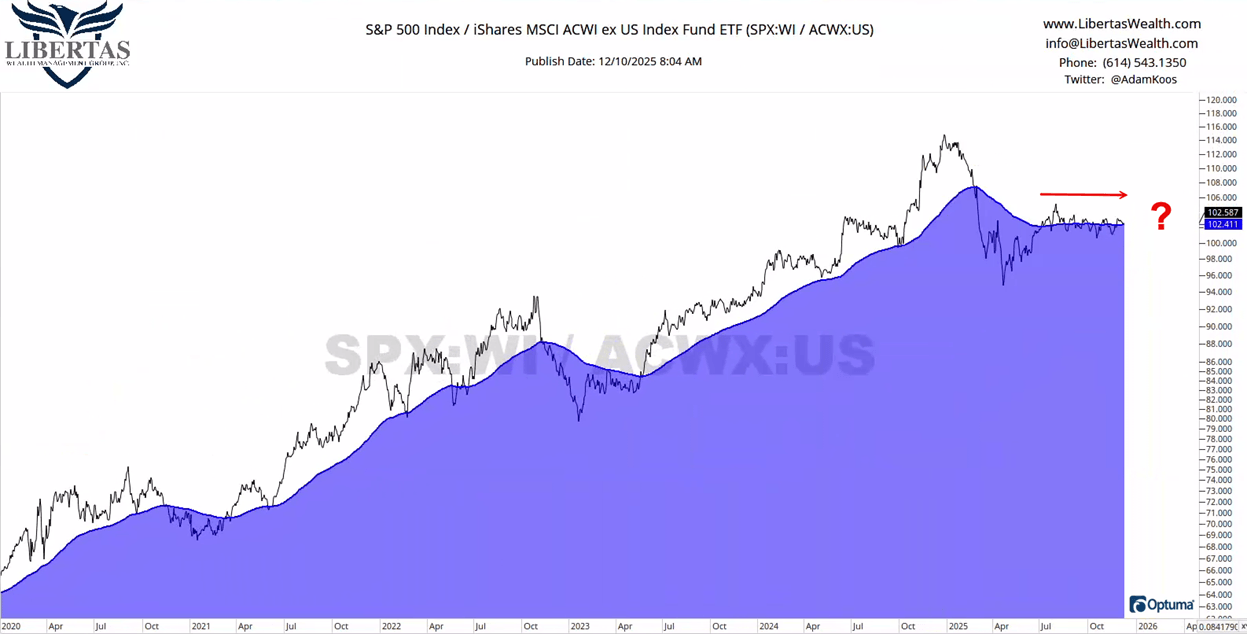
The recent picture between the U.S. and stocks overseas is easier to see in the chart below (I just zoomed in and started w/ 2020).
As you can see, international stocks became the winner earlier this year, just like they did in late-2022, but the battle shifted and currently rides on the 150MA, indicating a ‘trendless’ comparison at the moment.
However, this chart is going to resolve one way or the other, and it’s possible that this time could (finally) be the big pivot – where the U.S. loses ground to stocks around the world – but we’re just going to continue monitoring it and wait for the market to prove itself instead of speculating (i.e., trying to “predict” the trend… a practice that often brings nothing more than frustration).
Lastly, while I usually don’t like to talk about the “why,” one of the reasons “why” the U.S. vs. International stock relationship is changing is due to the U.S. Dollar weakening this year.
When the Dollar climbs in value vs. other world currencies, all things held constant, U.S. stocks tend to outperform due to the exchange rate between each country and the stocks that reside in each country, respectively.
When the Dollar falls in value vs. other world currencies, all things held constant, international stocks tend to outperform (for the very same reason).
Looking back in time, during COVID, the Dollar struggled, but made a huge comeback, peaking out in fall of 2022.
From there, it pulled back and chopped sideways through 2023 and 2024, when in the first quarter of 2025, it attempted to head back toward those 2022 highs… but failed, broke down, failed again to breakout… and now we see the Dollar trying to find the hole in the ice through which it fell, as it tries to climb back up & out from the icy, (polar) bearish water.
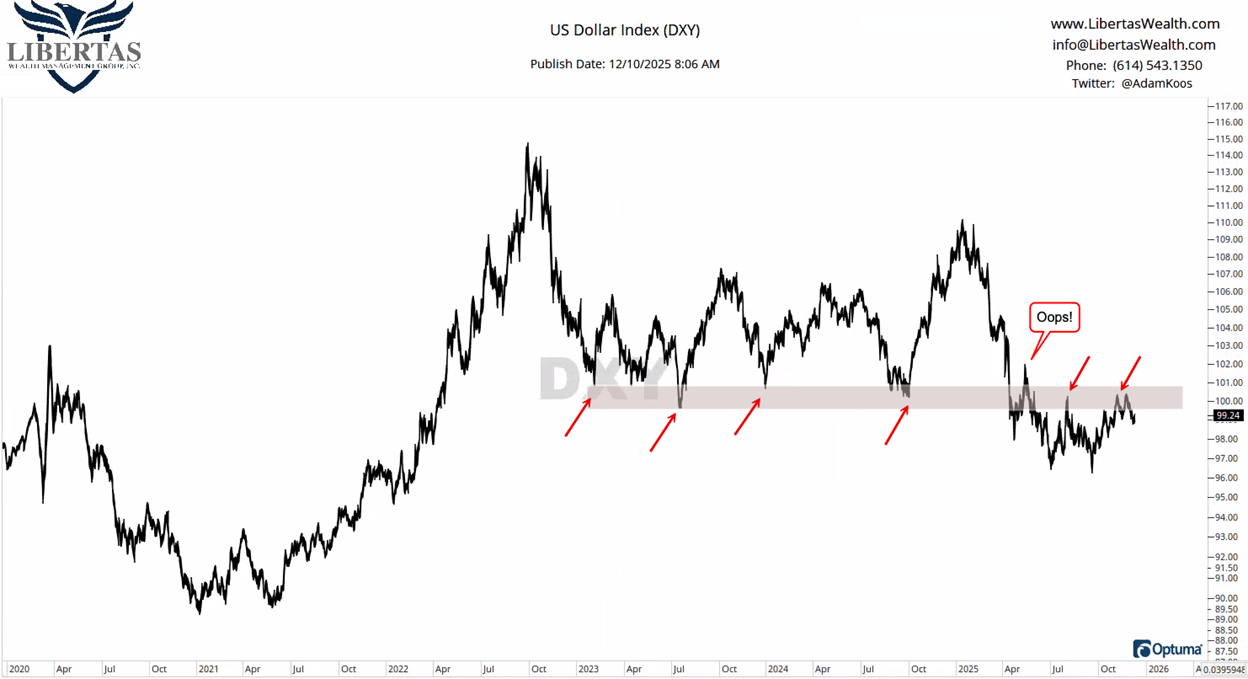
So if the USD continues to struggle and find itself drowning in that icy water below the ceiling of overhead resistance marked in the shaded area above, there’s a good chance we’ll see a long-term shift in momentum, where the strongest stocks in the coming months and years could end up being outside the U.S.
Unlock exclusive gold and silver trading signals and updates that most investors don’t see. Join our free newsletter now!
Author

CMT Association Research Team
CMT Association
The CMT Association is a global credentialing body that has served the financial industry for nearly 50 years.


