Gold Chart of the Week: More to come from the bulls for the week ahead?
- Gold bulls are in form although a correction could be on the cards.
- Until 4-hour support is broken, the bulls will remain in charge for the week ahead.

Gold defied gravity last week and simply continued higher despite the daily reversion patterns in the W-formation. Instead, bulls continued to position for runaway inflation pressures. The market is seemingly pricing the first US rate hike in for July and 60bp of hikes in 2022.
Moreover, the technical breakout will have likely attracted a significant amount of buying interest from both retail and longer-term players finally convinced that the only way now is up. ''At the same time, with US real yields remaining extremely low, the tides could sway the persistent waves of ETF sellers to add length,'' analysts at TD Securities argued.
''Further, gold prices need only solidify north of the $1870/oz range to catalyze further CTA long acquisitions, which should cement a more supportive trend," the analysts added. However, from a technical perspective, there have been no single down days in this latest surge in price within the month of November. For that reason alone, a pullback would be the likely scenario for the week ahead. There are two main areas of structure on the weekly chart that should be marked as follows:
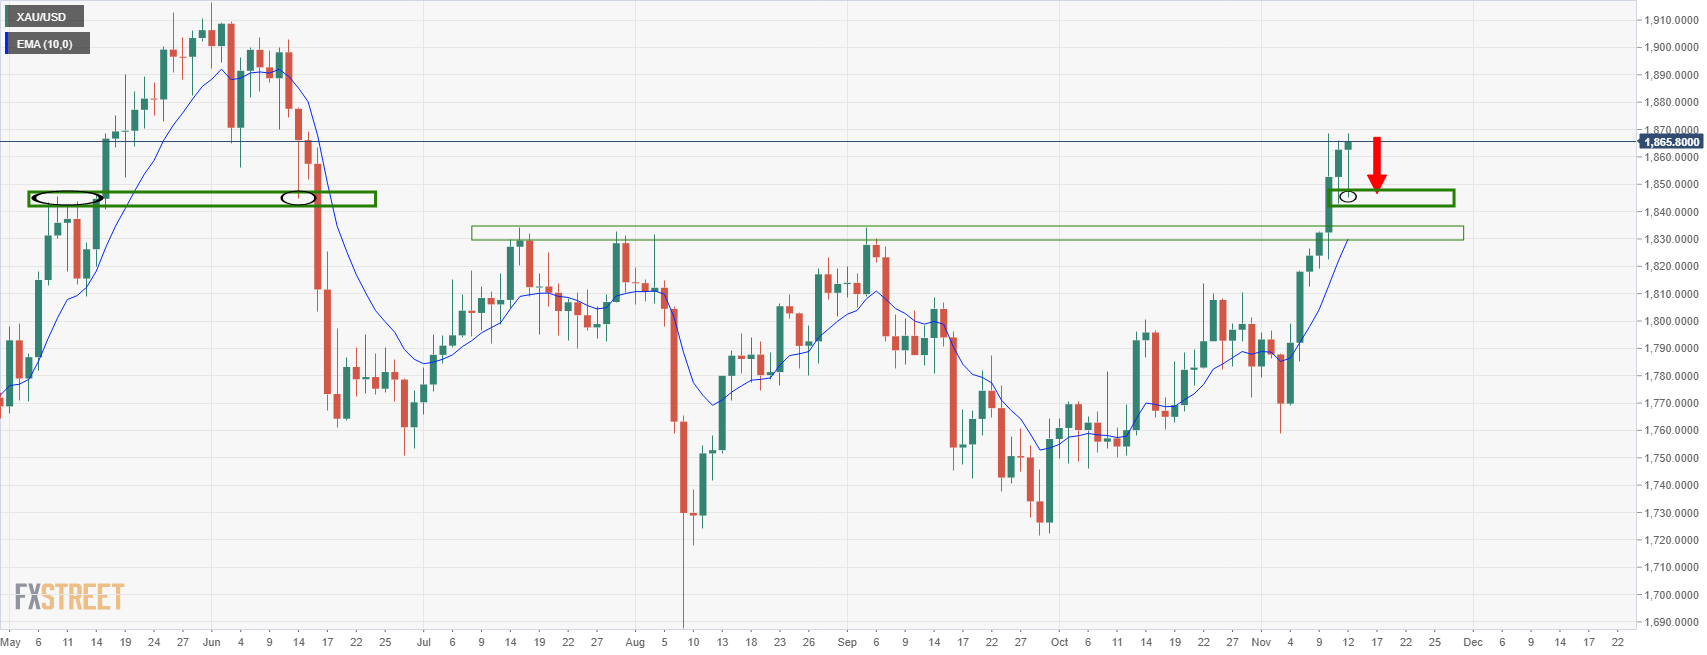
Weekly chart
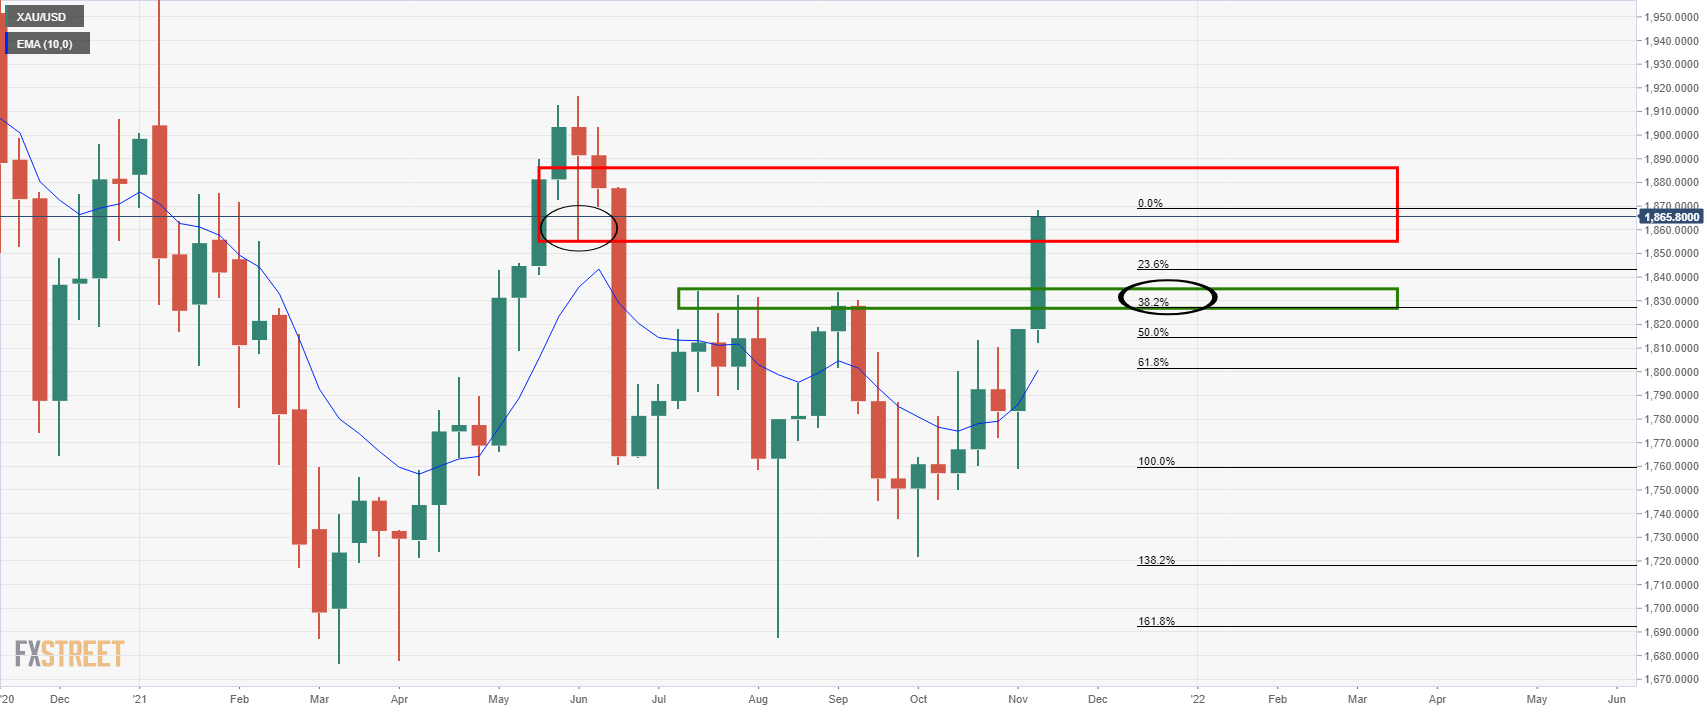
The price is testing a resistance zone and has pierced the 31 May lows already at 1,856. This gives rise to the prospects of a deeper test of the resistance area, potentially all the way to 1,880. However, based on current levels, we have a 38.2% Fibonacci retracement level that has a confluence with the prior resistance area in the 1,830s. From a daily chart's perspective, 1,845 is compelling:
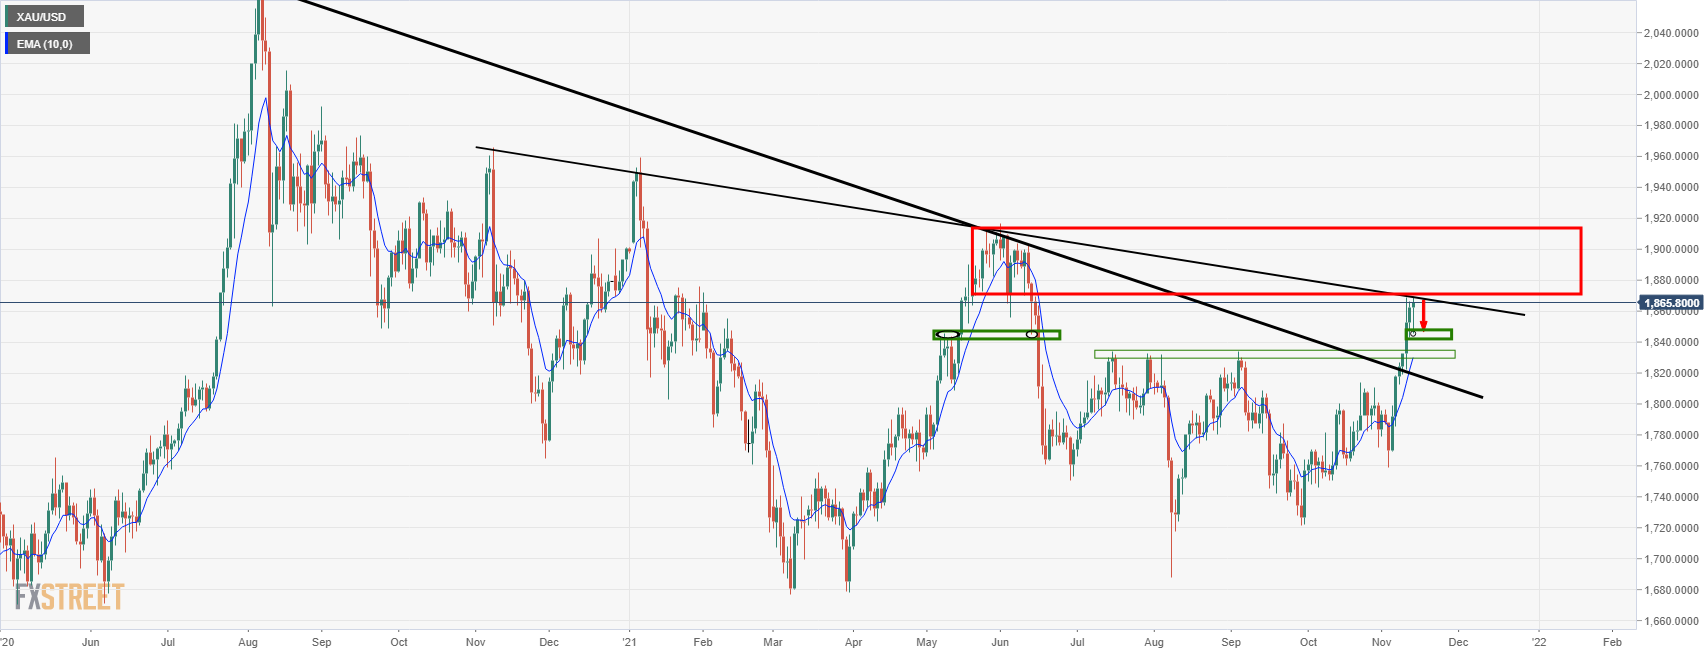
Gold daily charts
The aforementioned level was an area of interest earlier in the year, June 11 to be precise. However, before moving higher, the wick on Friday's chart represents an area of imbalance and price is typically attracted to fill imbalances. When coupled with the price being overextended without a recent bearish close, these make for a compelling argument for the downside at the start of the week. Additionally, a pullback following a trendline break is a common trait:
Gold 4-hour chart
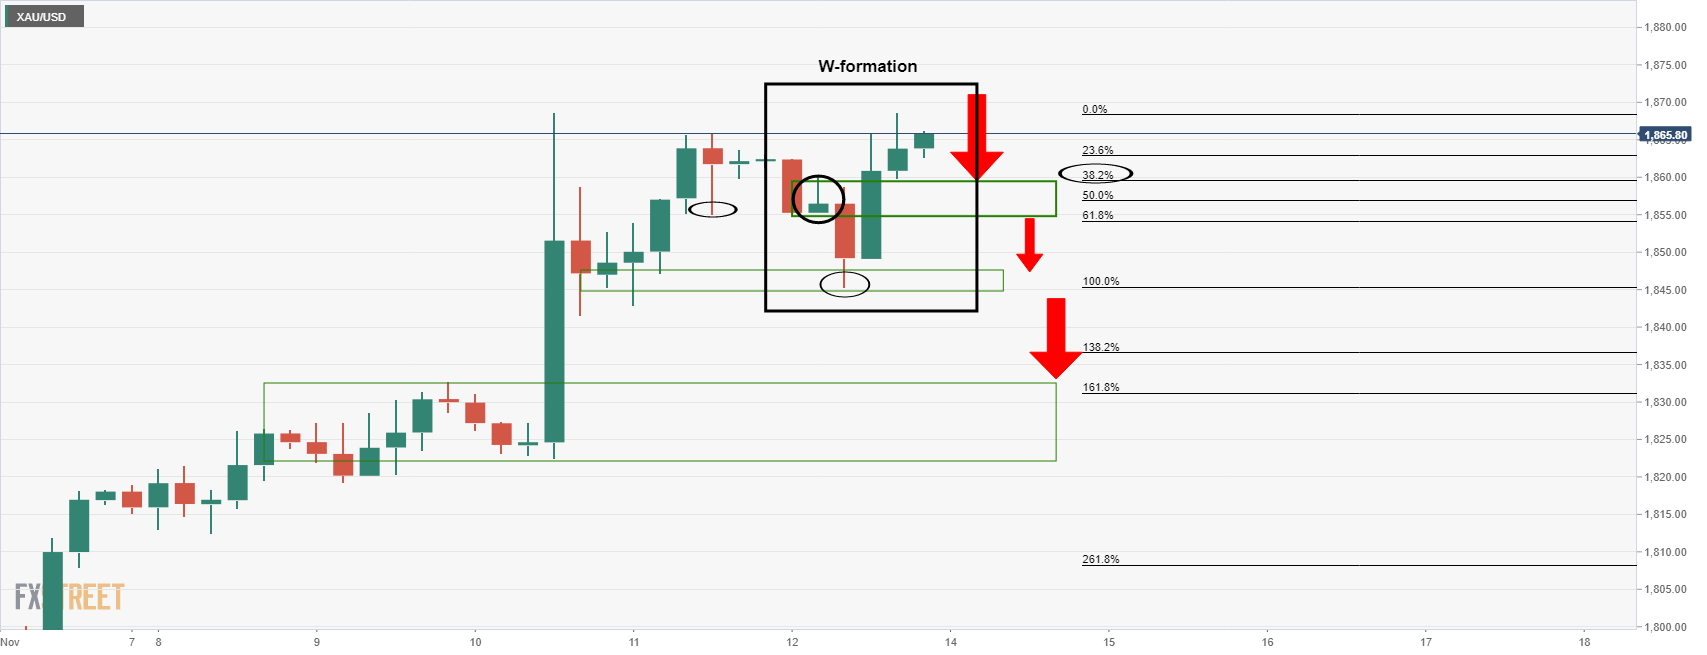
For those expecting the market to play out as forecasted above, then the 4-hour structure should be considered. There are a number of key levels and areas eclipsed in the above illustration to note. We have a W-formation and the 38.2% Fibo meeting the neckline which makes this an attractive area of interest. A break from there will then open risk to the downside as described above. Should this level hold, however, then the upside will be to play for.
Author

Ross J Burland
FXStreet
Ross J Burland, born in England, UK, is a sportsman at heart. He played Rugby and Judo for his county, Kent and the South East of England Rugby team.


