- GBP/USD has retreated from the highs amid fresh US inflation fears.
- Britain's reopening, the improving political landscape and BOE's move toward the exits are already in the price.
- Tuesday's four-hour chart Is pointing to an extended downside correction.
What goes up, must come down – even for the sake of resuming its gains again. GBP/USD has been fueled by pound-positive news, but a correction had been overdue after the massive rally. The trigger for the downside consolidation is the specter of inflation, which dominates the conversation in financial markets.
Dallas Federal Reserve President Robert Kaplan reiterated his warnings about an overheating US economy, and his words overshadowed that of his colleagues, who repeated the line that rising prices are temporary. Moreover, China's producer prices beat estimates, showing that increases in commodity costs are creeping into other areas of the economy.
That changed the market mood and allowed the safe-haven dollar to rise, alongside an increase in Treasury yields. Will this continue? Investors are holding their breaths ahead of Wednesday's US Consumer Price Index statistics for April.
US Consumer Price Index April Preview: The two base effects on inflation
The wait for the data may keep the lid on cable, despite sterling's impressive list of reasons to rise. The Bank of England's slowing down of its bond-buying scheme last week kicked off sterling´s gains. Another booster came from Scotland, where the Scottish National Party fell short of an absolute majority, slowing their strive for an independence referendum. Last but not least, Britain's consistent march toward returning to normal – with the next phase due on Monday.
The UK is emerging from lockdown and Wednesday's Gross Domestic Product figures for the first quarter will show how the country faired during the worst period.
UK GDP Preview: Contraction to trigger correction? Sterling set for a reality check
All in all, pound/dollar has good reasons to rise, but it may hesitate ahead of critical data releases.
GBP/USD Technical Analysis
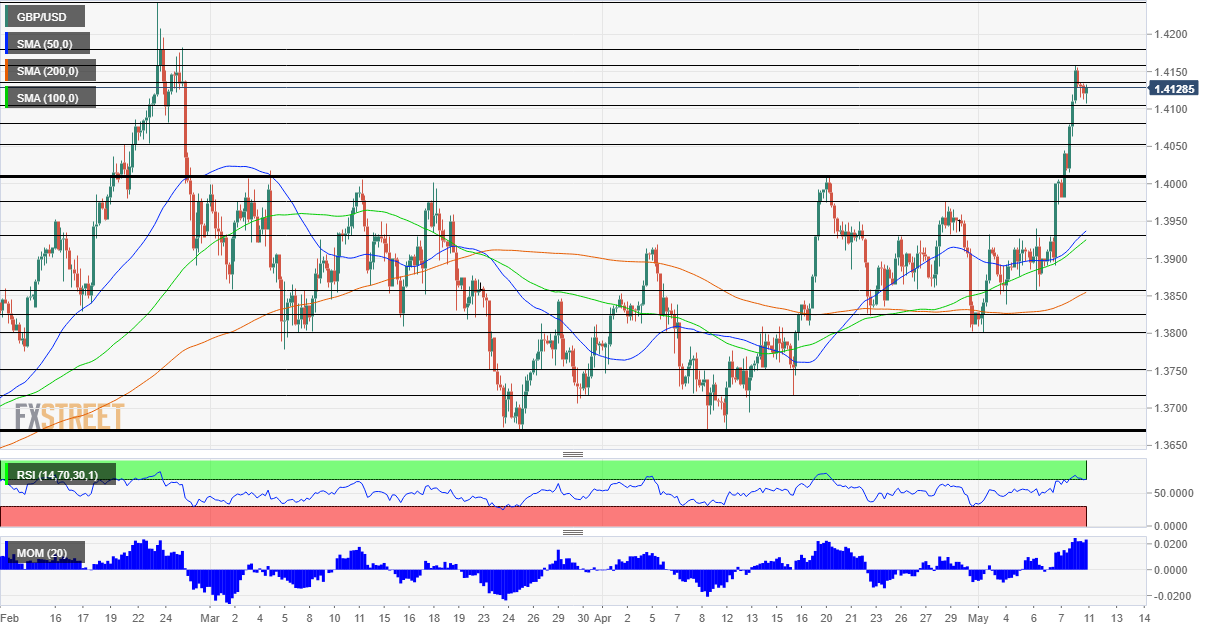
The Relative Strength Index (RSI) on the four-hour chart is just around 70 – overbought conditions. On the other hand, momentum remains to the upside and cable is till below the yearly highs.
Some resistance is at the daily high of 1.4145, followed by the May peak of 1.4160. Further above, 1.4180 and 1.4240 await the pair.
Support is at 1.41, the round number, followed by 1.4070, 1.4050 and 1.4010.
Information on these pages contains forward-looking statements that involve risks and uncertainties. Markets and instruments profiled on this page are for informational purposes only and should not in any way come across as a recommendation to buy or sell in these assets. You should do your own thorough research before making any investment decisions. FXStreet does not in any way guarantee that this information is free from mistakes, errors, or material misstatements. It also does not guarantee that this information is of a timely nature. Investing in Open Markets involves a great deal of risk, including the loss of all or a portion of your investment, as well as emotional distress. All risks, losses and costs associated with investing, including total loss of principal, are your responsibility. The views and opinions expressed in this article are those of the authors and do not necessarily reflect the official policy or position of FXStreet nor its advertisers. The author will not be held responsible for information that is found at the end of links posted on this page.
If not otherwise explicitly mentioned in the body of the article, at the time of writing, the author has no position in any stock mentioned in this article and no business relationship with any company mentioned. The author has not received compensation for writing this article, other than from FXStreet.
FXStreet and the author do not provide personalized recommendations. The author makes no representations as to the accuracy, completeness, or suitability of this information. FXStreet and the author will not be liable for any errors, omissions or any losses, injuries or damages arising from this information and its display or use. Errors and omissions excepted.
The author and FXStreet are not registered investment advisors and nothing in this article is intended to be investment advice.
Recommended Content
Editors’ Picks
AUD/USD bears in the market, chipping away into key support

AUD/USD bulls look to the 38.2% Fibonacci of the prior bearish leg and then 0.6725 which guards a continuation higher. Bears are in the market and eye a move deeper into support.
EUR/USD bears flirt with golden Fibonacci ratio, focus on 1.0765-60

EUR/USD seesaws around 1.0830-20 as the key Fibonacci retracement level probes bears during early Friday, following the Euro pair’s U-turn from a seven-week high the previous day. The Euro marked the first daily loss in six on Thursday as it failed to cross the two-month-old horizontal resistance area surrounding 1.0930-35.
Gold prods key hurdle as yields and US Dollar stabilize

Gold price struggles to extend two-day rebound as ascending resistance line from August 2022 prods bulls. Fresh concerns about banking crisis, Federal Reserve moves allow United States Treasury bond yields, US Dollar to lick their wounds.
Arbitrum airdrop flops, but ARB still makes it to a commendable all-time high. Here’s what happened

The token launch for Arbitrum was quite bumpy, to say the least after users could not claim their airdrop tokens for the first one hour post-launch. The turn of events was very disappointing, given that users had been waiting for a week for the highly-advertised ARB airdrop.
Is the banking crisis over, or is the worst yet to come?

When the Fed started signalling higher for longer last summer, everybody assumed that the first thing to break would be consumption, followed by big job losses.