GBP/USD Forecast: Pound Sterling loses bullish momentum, eyes on US CPI
- GBP/USD struggles to build on Tuesday gains, stays near 1.2850.
- Softer-than-expected inflation data from the UK limit Pound Sterling's gains.
- The US Bureau of Labor Statistics will release Consumer Price Index data for July.

GBP/USD lost its traction and declined toward 1.2800 in the European morning on Wednesday. Although the pair managed to erase its daily gains, it finds it difficult to build on Tuesday's climb ahead of US inflation data for July.
British Pound PRICE This week
The table below shows the percentage change of British Pound (GBP) against listed major currencies this week. British Pound was the strongest against the Japanese Yen.
| USD | EUR | GBP | JPY | CAD | AUD | NZD | CHF | |
|---|---|---|---|---|---|---|---|---|
| USD | -0.94% | -0.62% | 0.32% | -0.21% | -0.83% | -0.20% | -0.23% | |
| EUR | 0.94% | 0.35% | 1.26% | 0.72% | -0.01% | 0.75% | 0.75% | |
| GBP | 0.62% | -0.35% | 1.21% | 0.39% | -0.35% | 0.40% | 0.40% | |
| JPY | -0.32% | -1.26% | -1.21% | -0.52% | -1.20% | -0.51% | -0.55% | |
| CAD | 0.21% | -0.72% | -0.39% | 0.52% | -0.66% | 0.01% | 0.03% | |
| AUD | 0.83% | 0.00% | 0.35% | 1.20% | 0.66% | 0.75% | 0.76% | |
| NZD | 0.20% | -0.75% | -0.40% | 0.51% | -0.01% | -0.75% | -0.00% | |
| CHF | 0.23% | -0.75% | -0.40% | 0.55% | -0.03% | -0.76% | 0.00% |
The heat map shows percentage changes of major currencies against each other. The base currency is picked from the left column, while the quote currency is picked from the top row. For example, if you pick the British Pound from the left column and move along the horizontal line to the US Dollar, the percentage change displayed in the box will represent GBP (base)/USD (quote).
The UK's Office for National Statistics reported earlier in the day that inflation in the UK, as measured by the changed in the Consumer Price Index (CPI), rose to 2.2% on a yearly basis in July from 2% in June. This reading came in below the market expectation of 2.3%. In the same period, the core CPI increased 3.3%, down from 3.5% growth recorded in June. The immediate market reaction to these figures caused Pound Sterling to lose interest.
In the second half of the day, the US Bureau of Labor Statistics will publish CPI data for July. On a monthly basis, the CPI and the core CPI in the US are forecast to increase 0.2%.
According to the CME FedWatch Tool, markets are currently pricing in a stronger-than-50% probability of the Federal Reserve (Fed) lowering the policy rate by 50 basis points in September.
In case the monthly core CPI comes in above the market expectation, investors could reassess the odds of a large rate cut in September and trigger a rebound in the US Treasury bond yields. In turn, the US Dollar (USD) could gather strength and cause GBP/USD to edge lower. On the flip side, a soft print in this data could have the opposite impact on the pair's action.
GBP/USD Technical Analysis
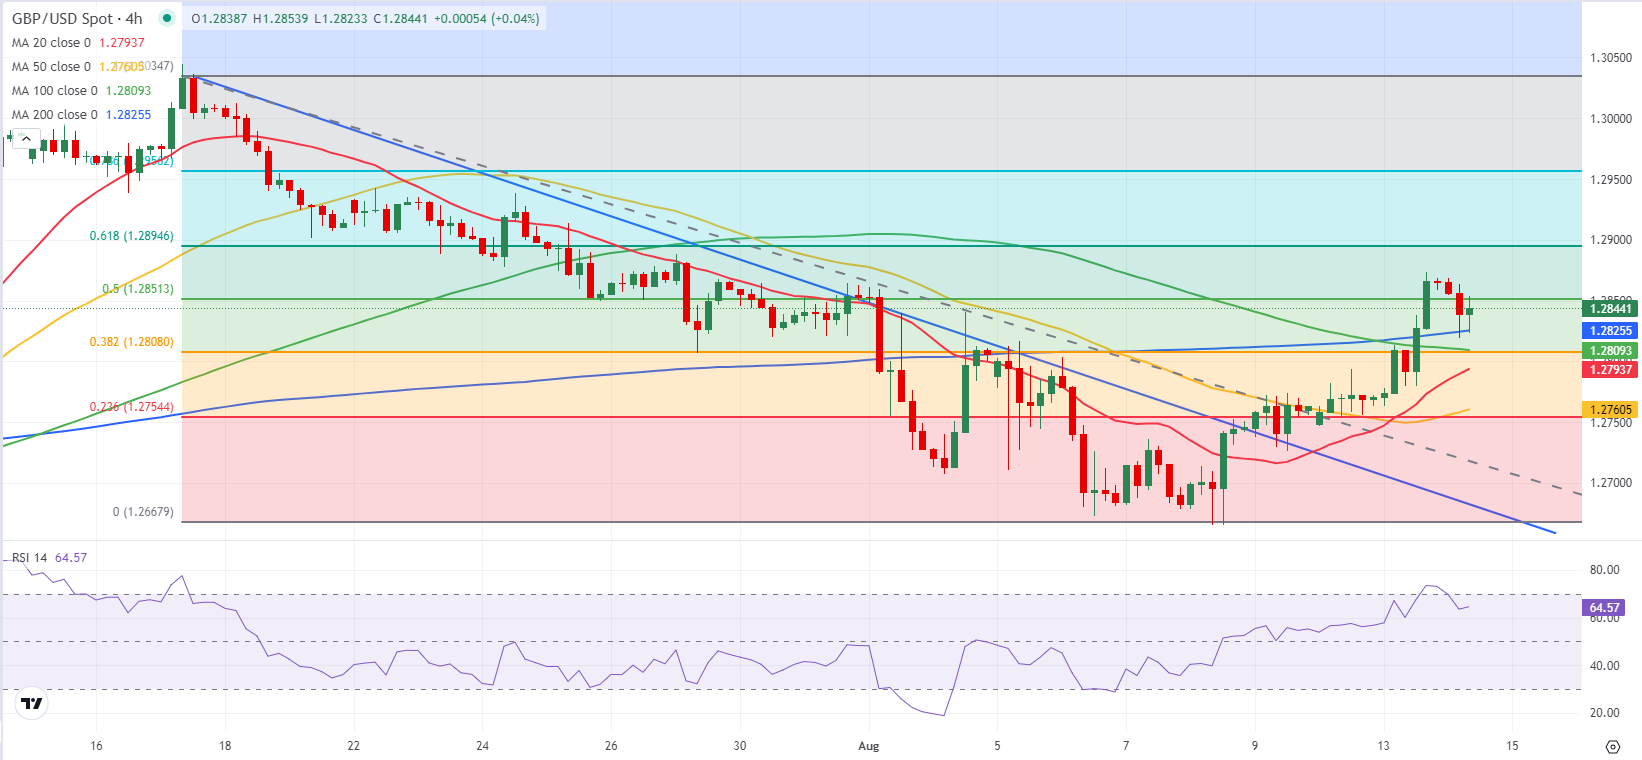
GBP/USD briefly dipped below the 200-period Simple Moving Average on the 4-hour chart but closed the last two candles above this level, reflecting sellers' hesitancy. Additionally, the Relative Strength Index holds above 60, pointing to a bullish bias in the near term.
On the upside, 1.2850 (Fibonacci 50% retracement of the latest uptrend) aligns as immediate resistance. If GBP/USD manages to stabilize above this level, 1.2900 (Fibonacci 61.8% retracement) could be seen as next resistance before 1.2950 (Fibonacci 78.6% retracement).
1.2825 (200-period SMA) could be seen as first support before 1.2800 (100-period SMA, Fibonacci 38.2% retracement) and 1.2760 (Fibonacci 23.6% retracement).
Inflation FAQs
Inflation measures the rise in the price of a representative basket of goods and services. Headline inflation is usually expressed as a percentage change on a month-on-month (MoM) and year-on-year (YoY) basis. Core inflation excludes more volatile elements such as food and fuel which can fluctuate because of geopolitical and seasonal factors. Core inflation is the figure economists focus on and is the level targeted by central banks, which are mandated to keep inflation at a manageable level, usually around 2%.
The Consumer Price Index (CPI) measures the change in prices of a basket of goods and services over a period of time. It is usually expressed as a percentage change on a month-on-month (MoM) and year-on-year (YoY) basis. Core CPI is the figure targeted by central banks as it excludes volatile food and fuel inputs. When Core CPI rises above 2% it usually results in higher interest rates and vice versa when it falls below 2%. Since higher interest rates are positive for a currency, higher inflation usually results in a stronger currency. The opposite is true when inflation falls.
Although it may seem counter-intuitive, high inflation in a country pushes up the value of its currency and vice versa for lower inflation. This is because the central bank will normally raise interest rates to combat the higher inflation, which attract more global capital inflows from investors looking for a lucrative place to park their money.
Formerly, Gold was the asset investors turned to in times of high inflation because it preserved its value, and whilst investors will often still buy Gold for its safe-haven properties in times of extreme market turmoil, this is not the case most of the time. This is because when inflation is high, central banks will put up interest rates to combat it. Higher interest rates are negative for Gold because they increase the opportunity-cost of holding Gold vis-a-vis an interest-bearing asset or placing the money in a cash deposit account. On the flipside, lower inflation tends to be positive for Gold as it brings interest rates down, making the bright metal a more viable investment alternative.
Author

Eren Sengezer
FXStreet
As an economist at heart, Eren Sengezer specializes in the assessment of the short-term and long-term impacts of macroeconomic data, central bank policies and political developments on financial assets.