GBP/USD eyes $1.35 whipsaw to $1.3524 - 1.3510

EUR/USD:
Weekly timeframe:
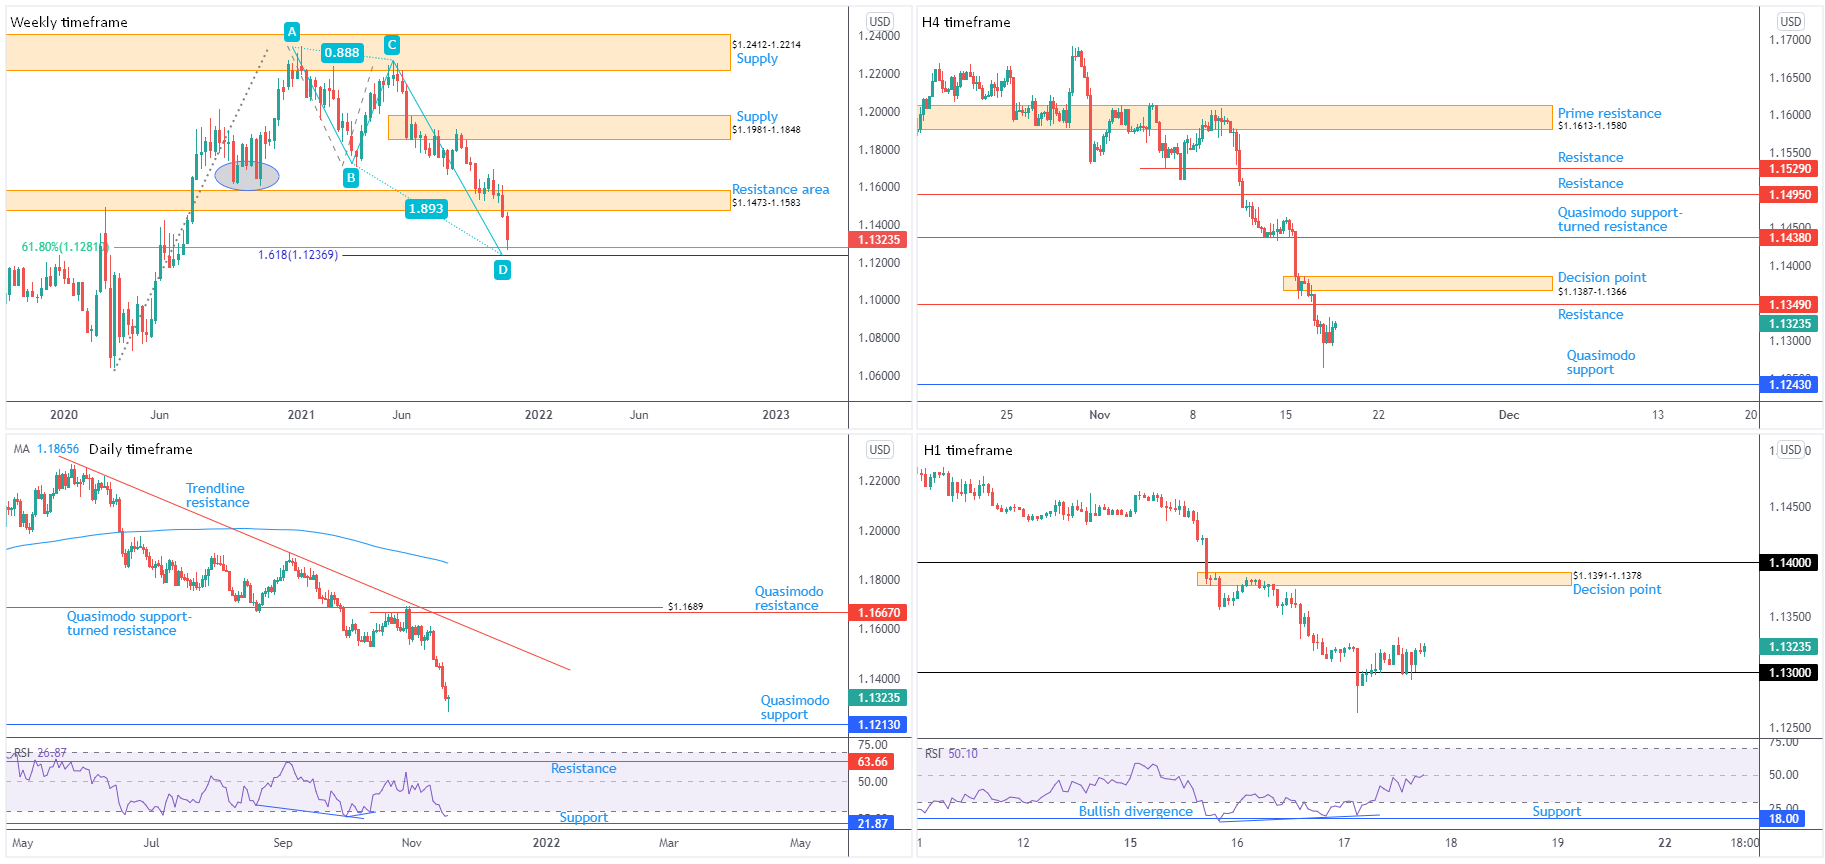
With prime support at $1.1473-1.1583 in the rear-view mirror, movement dropped in on support composed of a 61.8% Fibonacci retracement at $1.1281 and a 1.618% Fibonacci projection from $1.1237. Harmonic traders will acknowledge the 1.618% component represents an ‘alternate AB=CD bullish pattern’.
The above, coupled with the currency pair taking out 2nd November low (2020) at $1.1603, suggests (technically) we may be transitioning to a downtrend.
Daily timeframe:
shaped by way of a hammer candle pattern (bullish signal in oversold markets), EUR/USD refreshed 2021 lows at $1.1263, a handful of pips north of Quasimodo support at $1.1213 (positioned beneath the weekly timeframe’s Fibonacci structure).
While immediate flow has been trending lower since late May tops at $1.2266, momentum, according to the relative strength index (RSI), dropped in on oversold territory. It should be noted that the indicator can remain oversold for a prolonged period, having seen downside flow take root earlier this year. With that being said, though, particular emphasis is now on indicator support from 21.87.
H4 timeframe:
Having seen the US dollar index (daily timeframe) produce a meaningful shooting star from resistance between 96.37 and 95.80, Europe’s single currency concluded European trading marginally on the front foot against the US dollar.
The H4 scale is in the process of pencilling in a pullback towards resistance at $1.1349, a barrier sheltered beneath a decision point at $1.1387-1.1366. Failure to connect with the aforesaid resistances throws light on Quasimodo support from $1.1243.
H1 timeframe:
$1.13, albeit welcoming an early spike to a low of $1.1263, preserved a supportive tone heading into US hours on Wednesday—aided by the relative strength index (RSI) chalking up bullish divergence off indicator support at 18.00.
The $1.1391-1.1378 decision point (residing under $1.14) served sellers well Tuesday, an area therefore marked as an upside objective should buyers navigate higher levels.
Observed Technical Levels:
Weekly support making an entrance between $1.1237 and $1.1281, together with the daily timeframe forming a hammer candlestick pattern (and the dollar index forming a shooting star [inverse signals]), could elevate short-term flow to H4 resistance at $1.1349 and the decision point at $1.1387-1.1366.
The above implies buyers may hold ground north of $1.13 on the H1 and take aim at the decision point from $1.1391-1.1378 (wrapped around the upper edge of the H4 decision point mentioned above at $1.1387-1.1366).
AUD/USD:
Weekly timeframe:
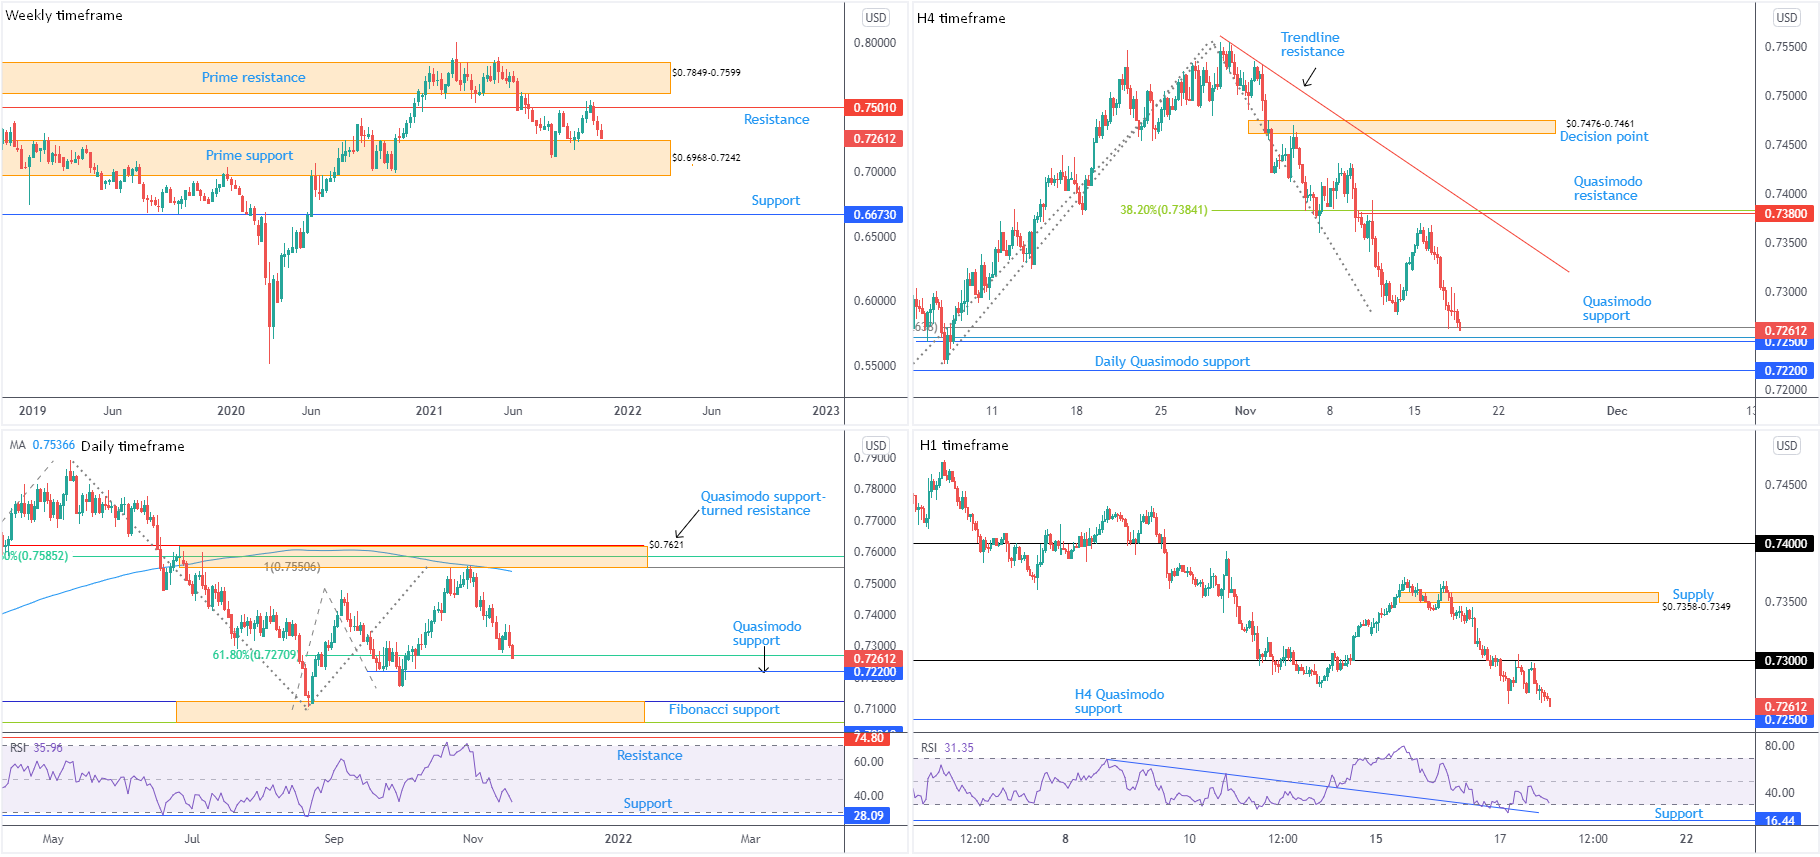
Resistance at $0.7501 proved notable, slotted just under prime resistance from $0.7849-0.7599. Notching back-to-back weekly bearish candles positions the unit on the doorstep of prime support from $0.6968-0.7242.
Despite current resistance, trend studies show we’ve been higher since early 2020.
Daily timeframe:
Following an early November slide from resistance between $0.7621 and $0.7551, an area housing a 61.8% Fibonacci retracement and a 100% Fibonacci projection, price is testing a 61.8% Fibonacci retracement at $0.7271 (sheltering Quasimodo support at $0.7220).
The trend on this timeframe remains in line with weekly movement: favours upside following the break of 3rd September high at $0.7478. Dip-buyers, therefore, could emerge between $0.7220 and $0.7271.
H4 timeframe:
Quasimodo support at $0.7250—set up with 78.6%/88.6% Fibonacci retracements at $0.7254 and $0.7264, respectively—elbowed into the spotlight Wednesday and formed a hammer pattern.
South of current support, of course, is the daily timeframe’s Quasimodo support at $0.7220.
H1 timeframe:
Despite USD downside, a relatively soft equity market weighed on risk sentiment, guiding the Australian dollar lower against major peers on Wednesday.
Dropping as far south as October levels, short-term players respected $0.73 yesterday and moved H4 Quasimodo support highlighted above at $0.7250 in the line of fire.
In terms of the relative strength index (RSI), should the value discover support around oversold, bullish divergence may materialise: informs traders that momentum to the upside is beginning to pick up pace.
Observed Technical Levels:
The upper edge of weekly prime support at $0.7242, current daily support between $0.7220 and $0.7271 (clipped to the upper edge of weekly prime support at $0.6968-0.7242) and the H4 Quasimodo support coming in at $0.7250 shapes a potential floor to be mindful of.
$0.7220-0.7271 may be a location sellers liquidate partial profits, and fresh buyers possibly make a show.
USD/JPY:
Weekly timeframe:
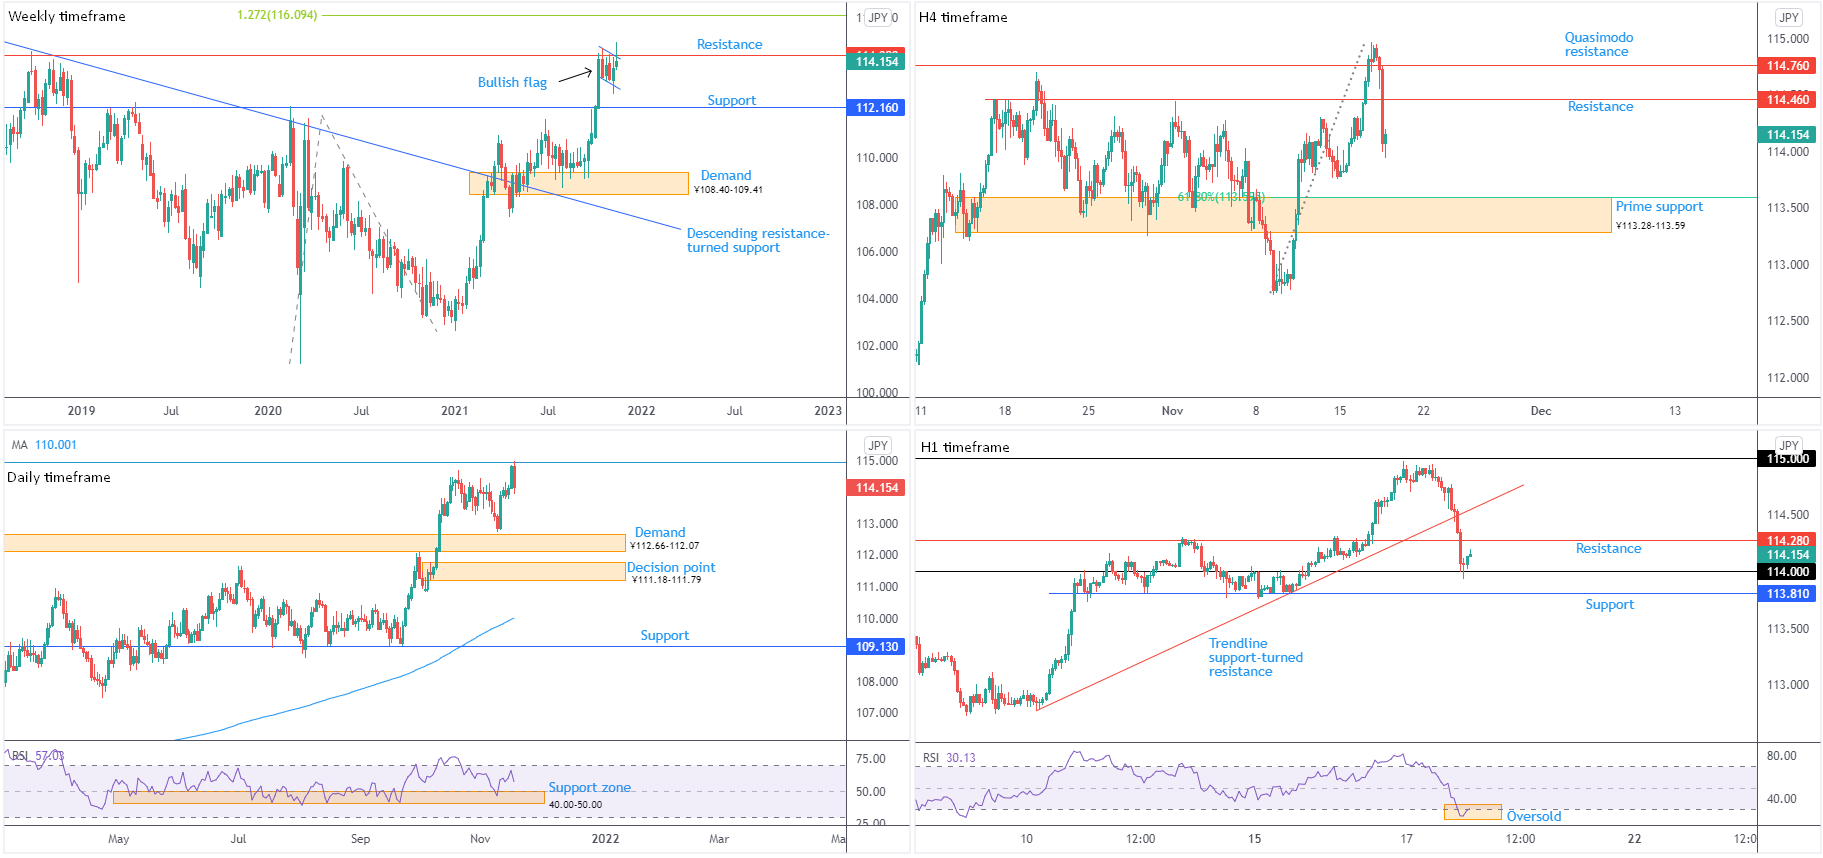
In the space of 48 hours, and despite clocking a fresh 4-year pinnacle at ¥114.97, the weekly timeframe went from strongly bullish to echoing a bearish tone.
Failing to find acceptance above resistance from ¥114.38 and the upper edge of a bullish flag between ¥114.70 and ¥113.41, a shooting star formation is in the offing.
Should we eventually explore space above resistance and the upper range of the noted flag, traders are urged to pencil in the 1.272% Fibonacci projection from ¥116.09.
In terms of trend, the unit has been advancing since the beginning of this year.
Daily timeframe:
A closer examination of technical structure on the daily chart shows Wednesday produced a bearish outside reversal from a 78.6% Fibonacci retracement at ¥114.94 (drawn from 15th December 2016 high at ¥118.66).
Lower, technicians will note attention remains on supply-turned demand at ¥112.66-112.07.
RSI (relative strength index) analysis reveals the value rebounded from support between 40.00 and 50.00 (amid prolonged uptrends, indicator support often forms around the 50.00 area and operates as a ‘temporary’ oversold base), and is nearing overbought.
H4 timeframe:
Quasimodo resistance at ¥114.76 (drawn from March 2017) held buyers on Wednesday, sending the currency pair back under resistance at ¥114.46.
Aside from Monday’s trough at ¥113.75, prime support falls in at ¥113.28-113.59 and a 61.8% Fibonacci retracement at ¥113.60.
H1 timeframe:
Confirmed by the relative strength index (RSI) registering an oversold signal, short-term activity discovered support off ¥114 and is bound for ¥114.28 resistance. This follows a one-sided decline through trendline support, extended from the low ¥112.78.
Support demands attention at ¥113.81 beneath ¥114.
Observed Technical Levels:
Scope to tunnel lower on the higher timeframes (in particular the daily chart’s bearish outside reversal from Fibonacci resistance), as well as some leg room lower on the curve seen on the H4 chart, shows bullish impetus derived from the H1 timeframe’s rebound off ¥114 may be short-lived. In fact, a bearish scenario unfolding from H1 resistance at ¥114.28 should not surprise, with sellers possibly taking aim at H1 support from ¥113.81.
GBP/USD:
Weekly timeframe:
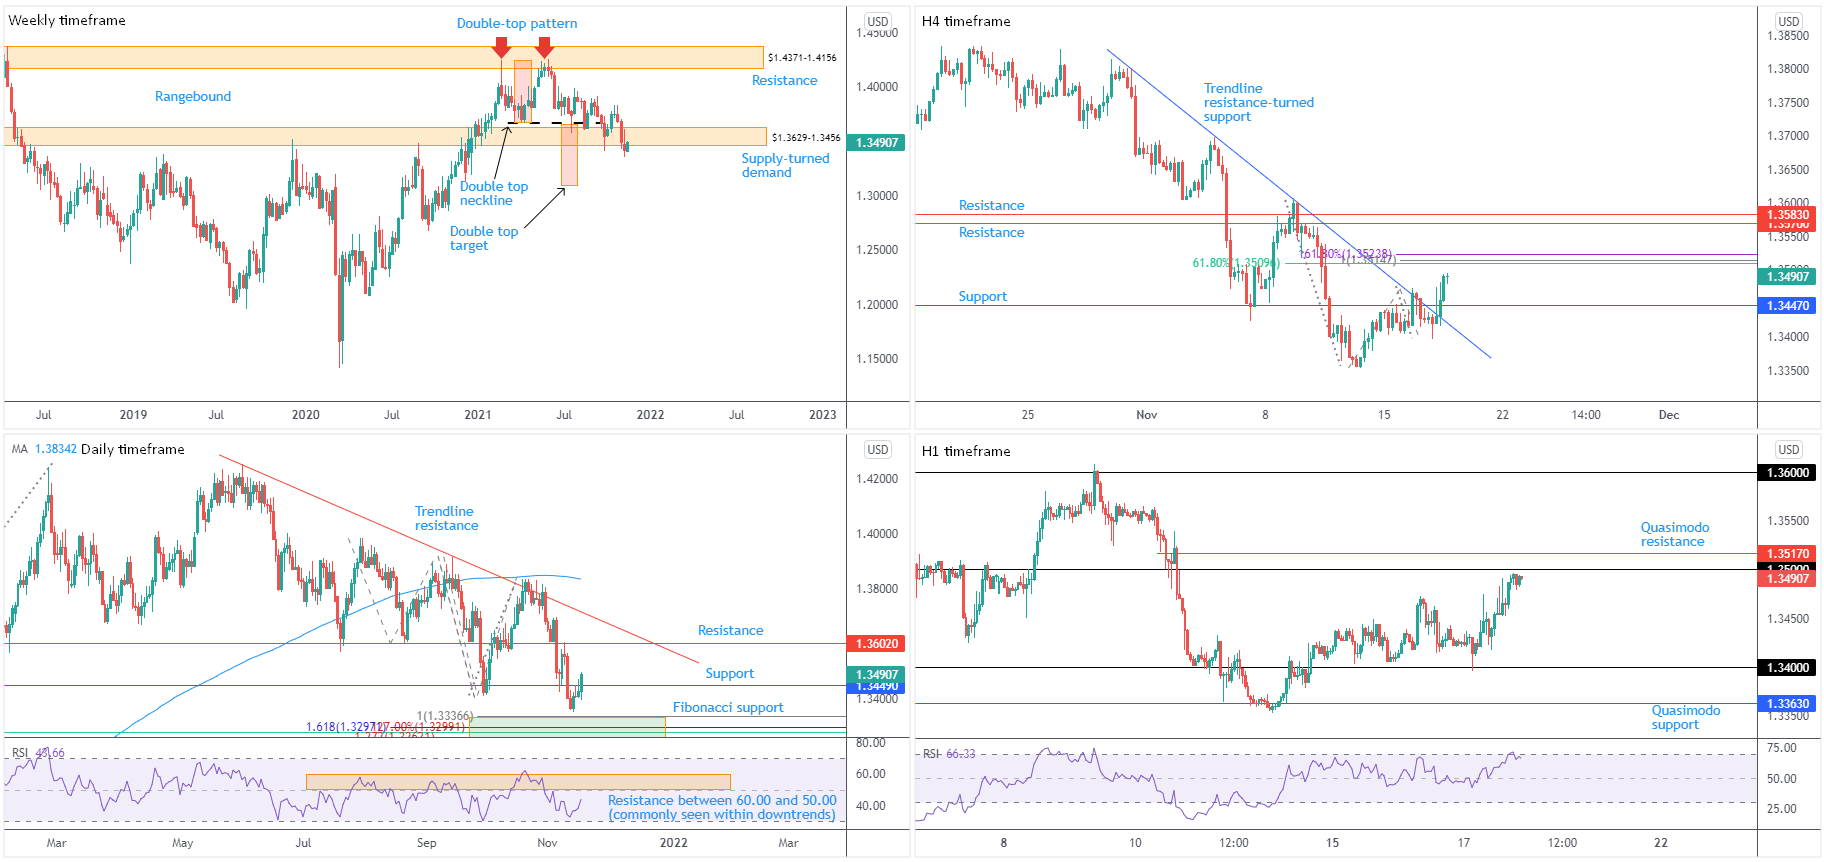
Supply-turned demand at $1.3629-1.3456 surrendered position last week, following a third consecutive weekly decline in the red. Month to date, November is down 1.4 percent. Couple this with price closing under a double-top pattern’s ($1.4241) neckline at $1.3669 in August, the weekly chart reflects a bearish technical outlook.
The double-top pattern’s profit objective—measured by taking the distance between the highest peak to the neckline and extending this value lower from the breakout point—delivers a downside target around $1.3093.
Daily timeframe:
Contrary to the weekly timeframe’s technical landscape, the daily timeframe exhibits a modestly optimistic view after taking resistance at $1.3449, underpinned on expectations of a BoE rate hike. The $1.3449 breach unmasks resistance at $1.3602 and trendline resistance, taken from the high $1.4250, forming clear upside objectives should optimism persist.
Longer-term sentiment has remained biased to the downside since June. In the event sellers step in, and we overthrow $1.3449 as support, keep a tab on Fibonacci support between $1.3262 and $1.3337.
H4 timeframe:
Price taking over resistance at $1.3447 (now support) and trendline resistance, taken from the high $1.3800, has set the stage for a run to resistance between $1.3524 and $1.3510 (a Fibonacci area including a 100% Fibonacci projection, which many harmonic traders will recognise as a bearish AB=CD).
North of the aforementioned resistance, eyes are likely to be on resistance around $1.3580ish.
H1 timeframe:
A modest top is taking shape ahead of $1.35, following a spirited advance off $1.34 earlier in the session on Wednesday. Interestingly, 17 pips above $1.35 rests Quasimodo resistance at $1.3517. Note this level could be an area we see strong sellers emerge from—those looking to take advantage of bullish flow derived from any buy-stops tripped above $1.35.
The relative strength index (RSI) touched gloves with overbought territory in recent action, a zone supporting a bearish picture from $1.3517.
Observed Technical Levels:
H1 Quasimodo resistance at $1.3517, set within H4 resistance between $1.3524 and $1.3510, is positioned to welcome any whipsaw above $1.35. A decisive close back under $1.35 is also likely to attract further short-term downside, zeroing in on at least daily support at $1.3449.
Author

Aaron Hill
FP Markets
After completing his Bachelor’s degree in English and Creative Writing in the UK, and subsequently spending a handful of years teaching English as a foreign language teacher around Asia, Aaron was introduced to financial trading,